3.9 Debt Ratios and
Decomposing Financial Leverage and Solvency
It is an open question
whether the financing decision adds value to shareholders or
not. We will make
two observations here.
First, we have already seen that increasing financial
leverage has a positive impact upon ROE.
This follows from the DuPont analysis where ROE was the
product of ROA and Financial Leverage.
However, it also increases risk and so equity investors
will require a higher rate of return.
If this higher rate of return exactly offsets the
positive impact from financial leverage then it is all awash and
the financing decision has no impact upon shareholder value.
If the financing decision interacts with the investment
decision, for example as per a financial institution then the
financing decision matters.
As a result, when analyzing the financing decision
analysts are interested in assessing the risk of the firm and
ultimately how this risk translates into changes in the cost of
equity capital. We
consider this issue formally in the Valuation part of this book.
But first, we will analyze the financing decision and
then relate it to growth forecasts for net income.
Solvency versus Liquidity
If a firm’s financial
leverage becomes too high then questions arise regarding whether
or not a firm is likely to be a going concern.
Firms go bankrupt because they lack the cash (and or
access to cash) to repay debt.
Liquidity analysis adopts a short run focus and liquidity
ratios are designed to assess a firm’s ability to meet their
short term obligations.
Solvency on the other hand adopts a longer term focus and
Debt Ratios attempt to assess a company’s ability to meet its
long term obligations and thus whether it is a going concern.
Recall from the DuPont
decomposition that the Financial Leverage term is
Assets/Shareholders Equity.
Shareholders equity is defined from the basic accounting
identity as:
Total Assets –
Total Liabilities = Shareholders or Shareholders Equity
Dividing through by
shareholders Equity and rearranging then the Financial Leverage
term can be re-expressed as:
Financial Leverage
= Total Assets/Shareholders Equity
= 1 + Total Liabilities/Shareholders Equity
The last term is more
commonly expressed relative to Total Assets as the Debt Ratio:
Debt Ratio = Total
Liabilities/Total Assets
There are a number of
variations to the Debt Ratio and the ones covered by the
Valuation Tutor calculator are listed and defined below:
Debt to Assets =
(Long Term Debt + Debt Due within One Year) / Total Assets
Debt to Capital =
(Long Term Debt + Debt Due within One Year) / Total Equity
Debt to Equity
=(Long Term Debt + Debt Due within One Year) / Shareholders’
Equity
Financial Leverage
= Total Assets/Shareholders Equity = 1 + Total
Liabilities/Shareholders Equity
Long Term Debt
Ratio = (Long Term Debt / Shareholders’ Equity)
In addition, when interest
expense is focused upon this also defines a coverage ratio:
Interest Coverage =
EBIT/EBT
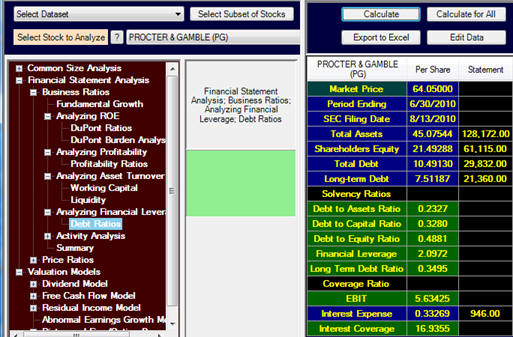
Tutor Reconciliation:
Proctor and Gamble (PG)
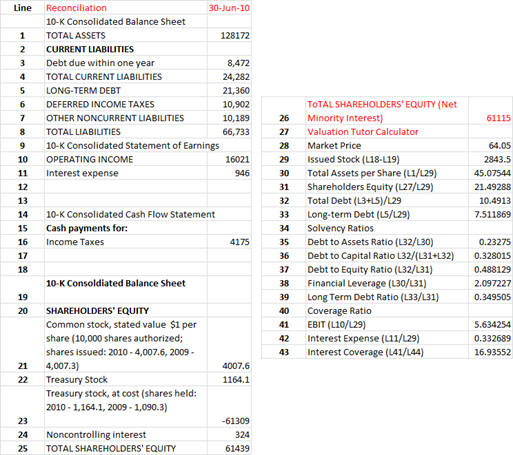
Our objective is to reconcile the following from the 10-K:
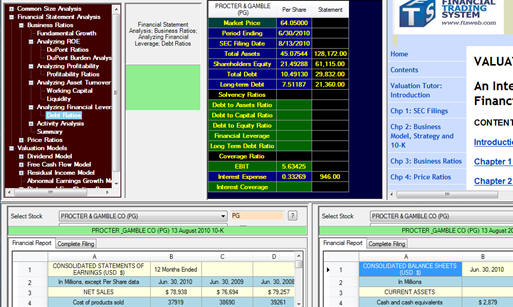
Step 1:
Bring up the Income Statement and Balance Sheet for
Proctor and Gamble as described in section 3.2 as displayed
above.
For Proctor and Gamble you will see that Debt Due within one
year = $8,472 and the “Long Term Debt” ($21,360).
Step 2:
Click on Calculate and we can verify the input and
derived fields for the following: