3.4 DuPont
Analysis
As we showed, fundamental growth for a firm equals Return on
Equity (ROE) times the Retention Ratio (RR):
Growth = ROE * RR
The DuPont model re-expresses the accounting return on equity
(ROE) as the product of the Return on Assets (ROA) and Financial
Leverage (measured by Total Assets/Shareholders’ Equity).
ROE and ROA are two major ratios that are associated with
the “Financial Perspective” of the balanced scorecard.
The DuPont decomposition has an interesting history:
Among the stocks that currently make up the Dow Jones Industrial
Index the oldest is E. I. du Pont de Nemours And Company more
commonly referred to simply as DuPont.
DuPont was originally a gunpowder mill founded in July
1802 by Eleuthère Irénée du Pont and today is one of the largest
chemical companies in the world. DuPont was a pioneer with
respect to management accounting systems, including devising the
accounting ratio Return on Investment (ROI).
Around 1912 their ROI approach was extended by one of
their financial officers, Donaldson Brown, who decomposed the
ROI calculation into a product of the sales turnover ratio and
the profit margin ratio.
In 1914 DuPont invested in General Motors (GM) to assist
the struggling automobile company.
In 1920, Pierre DuPont became chairman of GM, and during
his tenure implemented a pioneering management accounting system
that focused sharply on planning and control.
By organizing resources around this system GM grew to be
the largest automobile company in the world.
In 1957 DuPont had to divest itself of General Motors
because of the Clayton Antitrust Act.
The DuPont decomposition became popular after its
successful use at GM and DuPont.
As a reminder, we note that ROE = Net Income/Shareholders
Equity, and ROA = Net Income/Total Assets.
ROE measures the rate at which shareholder wealth is
increasing, while ROA measures the productivity of the assets in
generating income, and therefore measures the efficiency of the
investment decision.
Formally, the DuPont formula is:
ROE = (Net Income/Sales) * (Sales/Total Assets) * (Total
Assets/Shareholders’ Equity)
Each term in the decomposition has a specific meaning:
Profit Margin Ratio = Net Income/Sales
Asset Turnover Ratio or Asset Use Efficiency = Sales/Total
Assets
Financial Leverage Ratio= Total Assets/Shareholders Equity
Step 1:
Bring up the Income Statement and Balance Sheet for
Proctor and Gamble as described in section 3.2.
This was displayed at the bottom of the screen as
follows:
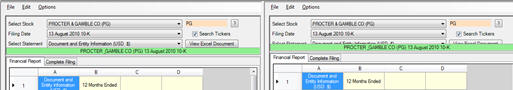
We can reconcile the DuPont decomposition by selecting the
Consolidated Income Statement and Consolidated Balance Sheet as
follows:
Step 2:
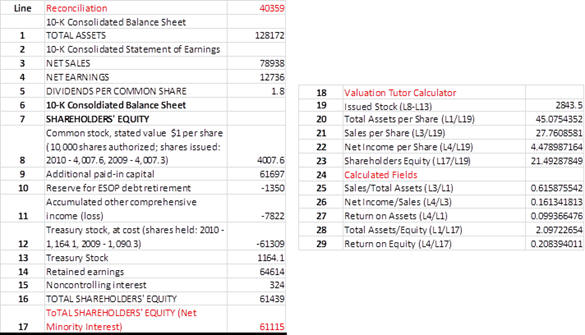
Refer to the calculator part of the Valuation Tutor
screen. This has
computed DuPont decomposition from the following per share
fields:
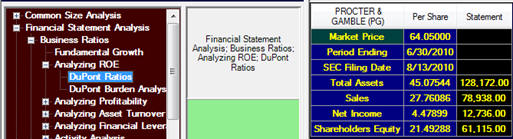
Total Assets per Share = $45.075
Sales per Share = $27.761
Net Income per Share = $4.479
Shareholders’ Equity = 21.4929
Step 3:
Click on Calculate for the DuPont decomposition:
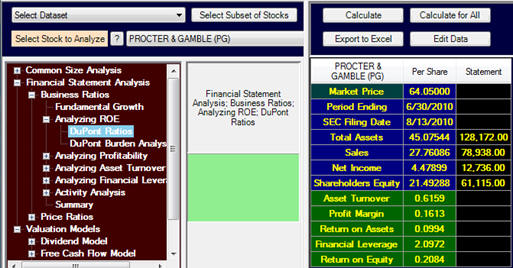
You can observe above the additional derived fields are:
Sales/Total Assets = 0.6159 = Assets Turnover Ratio or Asset
Efficiency
Net Income/Sales = 0.1613 = Profit Margin Ratio
Return on Assets = 0.0994 = Product of the Asset Turnover Ratio
and Profit Margin Ratio.
Total Assets/Total Equity = 2.0972 = Financial Leverage Ratio
Return on Equity (ROE) = 0.2084
So Proctor and Gamble’s has enhanced its ROA by exploiting
financial leverage.
Later in this chapter, you will learn how to interpret these
numbers but first:
Step 4:
Where did these numbers come from?
Each of the numbers can be traced back to two primary financial
statements:
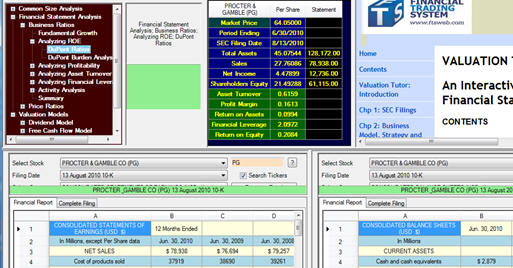
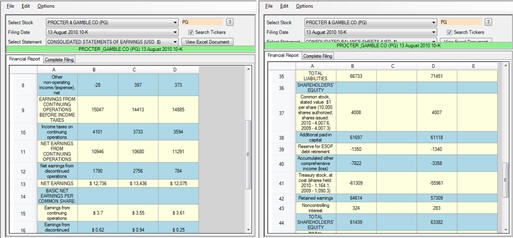
For convenience we relate the numbers in the 10-K to a summary
grid as depicted below and then refer to the line numbers in the
summary grid. So
for example from this you can see that the Net Sales is $78,938
and the Total Assets are $128,172 and so on.