
Chapter 3: Questions
Question 1:
Define the basic DuPont decomposition
equation and include a brief description of how to interpret its
component terms by relating your description to the major
decisions made by a firm.
Question 2:
Calculate and provide a
brief description of its meaning the following ratios for Best
Buy:
i.
Inventory Turnover
ii.
Accounts Receivable
Turnover
Question 3:
i.
If the Inventory Turnover
ratio is X, how many days does it take to sell the inventory?
ii.
If the Accounts Receivable
Turnover ratio is X, how many days does it take for accounts to
be paid?
Question 4:
Define the ratio “ROE” and describe what major firm decisions
influence this ratio.
Question 5:
Define “Fundamental Growth” (also known as “Accounting
Growth”). Describe
precisely how this number is influenced by major firm decisions.
Question 6:
Consider the
following information on Best Buy and Wal-Mart:
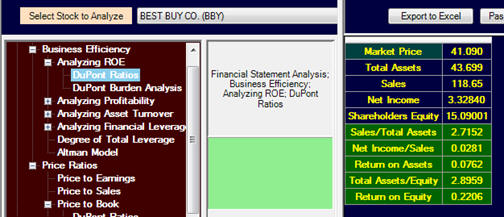
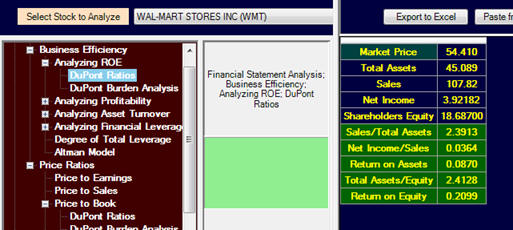
Compare the ROE for Wal-Mart and Best Buy and explain precisely
why the two companies have different ROE’s by relating your
explanation to the major firm decisions.
Question 7:
Estimating Cost Behavior using Account Analysis
In order to estimate the Degree of Operating Leverage, you need
to first separate costs into fixed and variable components.
This requires an understanding of cost drivers, and GAAP
compliant statements do not provide an easy way to break total
costs into fixed and variable parts.
When studying managerial accounting, you are typically
introduced to three techniques to assess cost behavior.
i.
Account Analysis
ii.
High Low Technique
iii.
Regression Analysis/Scatter Plots
In this question you will apply the
Account Analysis
technique. With
this technique start by reading Item 1, 10-K of Amazon’s 10-K
filed with the SEC.
This describes their business model.
From this business model and without referring to any
quantitative data, so that your answer is based entirely upon
your understanding of the business model for Amazon.com, apply
the Account Analysis technique (i.e., professional judgment) to
assess the cost behavior for the following three cost categories
for Amazon.com.
That is, consider how these costs are likely to be generated
given your understanding of Amazon’s business.
This will let you
understand what the major cost drivers are likely to be for the
following three categories:
a.
Cost of Goods Sold
b.
Selling and General Administration
c.
Research and Development
Estimate the proportion of each of the above cost categories
that you assess to be variable and fixed (relative to sales
revenue). The sum
of these proportions must equal 1.
Provide brief reasons in support of you assessed
proportions in relation to your understanding of Amazon’s
business model.
Question 8:
Estimating Cost Behavior using High Low Technique
In this question you will apply the
High Low technique to
separate total costs into fixed and variable components.
This method uses observations on two dates to estimate fixed
costs and the variable cost per dollar of sales revenue.
The Y-Axis variable is the aggregate cost category and
the X-axis variable is the volume of activity (usually sales
revenue for an outsider).
Variable Cost Per $ Sales Revenue
= (Total Costs High Sales Revenue – Total
Costs Low Sales Revenue)/(Sales RevenueHigh
– Sales RevenueLow)
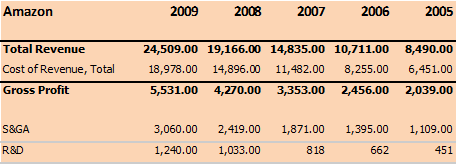
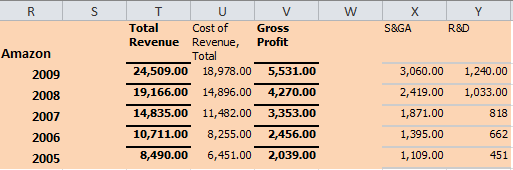
Data:
Suppose Amazon’s Sales
Revenue and COGS for the last 5-years is the following:
Apply the High Low Technique to compute the variable costs per
dollar of sales for each of the following categories:
a.
Cost of Goods Sold
b.
Selling and General Administration (S&GA)
c.
Research and Development R&D
Question 9:
Estimating Cost Behavior using Regression Analysis
In this question you will apply the Regression Analysis
Technique to separate total costs into fixed and variable
components.
This is a statistical technique for estimating fixed and
variable costs.span style="mso-spacerun: yes"> The
advantage of this technique over the high low technique is that
it uses all observations whereas the high/low technique uses
only two.
Regression analysis is easy to perform in Excel using the
following steps. WWe
show you how to decompose the total COGS into fixed and variable
components, the problem you solve is to repeat this for SG&A and
R&D using the following information.
Step 1:
In Valuation Tutor select Amazon and then click on
Financial Statements, Statements (MSN):
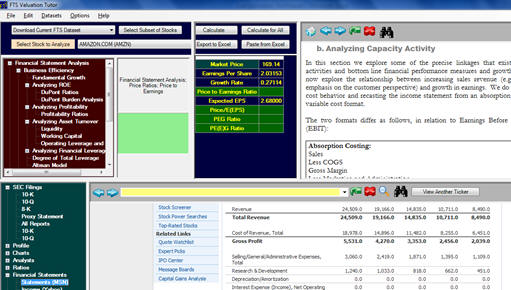
Step 2:
Copy and paste the data into Excel and then use Excel’s
Copy/Paste Special Transpose to get the data into the following
block form ready for Regression:
The Y-Variable for the regression is in column U (U2..U6) and
the X-Variable is in column T (T2..T6).
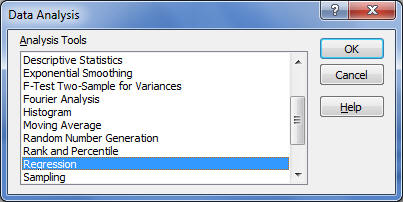
Step 3: Click on the “Data” menu item in Excel and then select
Data Analysis from the Analysis ribbon item
Note:
If the Data Analysis item is not available, then in
Excel, click on the Office Button, click on Excel Options, click
Add-Ins and at the bottom, under “Manage Excel Add-Ins” – select
the Analysis Tool Pack and click OK.
TThen close Excel and re-launch it.
Step 4:
In Data Analysis select Regression:
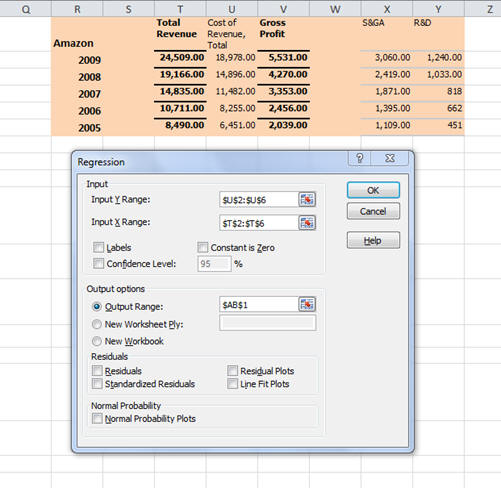
Note in the above the COGS is the Y-Variable and the Sales
Revenue is the X-Variable (cost driver).
Click OK and the regression analysis is performed:
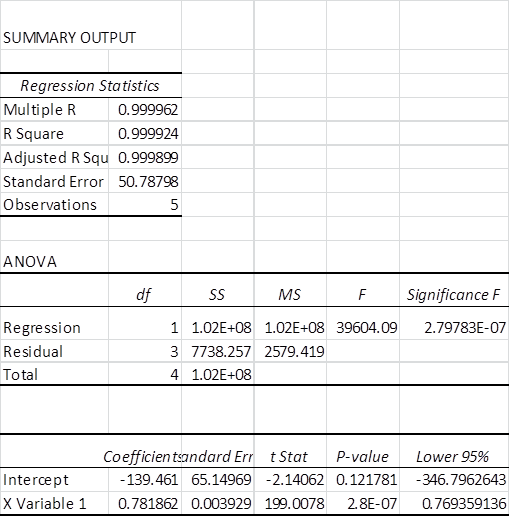
The variable cost per $ of sales is provided above beside X
Variable 1 and equals 0.78.span style="mso-spacerun: yes">
In this example it turns out to be very similar to the
High/Low method in the previous question – but this is not the
norm. AAgain the
variable cost per $ of sales revenue is 0.78.
Repeat the above exercise to estimate the Variable Cost per $ of
Sales for both S&GA and R&D respectively.
Question 10: If you have completed questions 7 and 8 or questions 7 and 9
then answer the following.
In question 7 you assessed cost behavior using the Account
Analysis technique.span style="mso-spacerun: yes">
This required professional judgment in relation to your
understanding of Amazon’s business model.
In questions 8 or 9 you made use of data to estimate the
proportion of variable to fixed costs in each category.
Did your estimates agree or disagree when using these two
approaches? PProvide
a brief discussion as to why or why not.
Information for the next three questions:
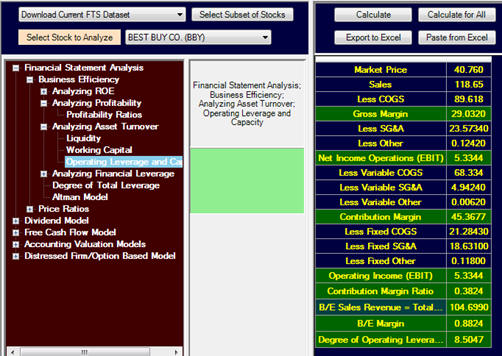
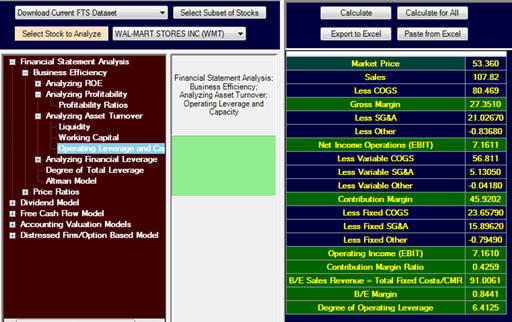
Question 11:
UUsing the above information for Wal-Mart and Best Buy,
define the contribution margin ratio, verify the calculation,
and provide a brief description of what it means.
Question 12:
Using the above
information for Wal-Mart and Best Buy, provide a brief
interpretation of what could explain the differences in the
contribution margin ratio for Wal-Mart and Best Buy.
Question 13:
Use the above information for Wal-Mart and Best Buy.
Suppose you expect sales for each company to increase by
3% over the next year.
WWhat is the predicted impact upon EBIT?
Real World Exercises
Exercise 1: Business
Ratios
Select two companies from
the Current FTS Dataset that are competitors, or at least are in
the same industry even if they do not directly compete with each
other.
Provide a summary report
of the results from conducting financial statement analysis of
the business ratios for your two stocks relative to each other.
Summarize what you view to be comparative advantages and
disadvantages for these two stocks relative to this analysis.
IIn addition, comment on how efficiently you assess each
firm is when implementing their business model/business strategy
based upon your analysis of their business ratios.
Exercise 2: Activity
Analysis
Select two companies from the Current FTS Dataset that are
competitors, or at least are in the same industry even if they
do not directly compete with each other.
By applying Valuation
Tutor’s Activity Analysis Calculator (e.g., Asset Turnover and
Financial Leverage subsections of the Business Efficiency
section), provide a summary report of the results from
conducting Activity Analysis for your two stocks and then
compare along the following dimensions:
i.
Degree of Operating
Leverage
ii.
Degree of Financial
Leverage
iii.
Degree of Total Leverage
iv.
Contribution Margin and
Contribution Margin Ratio
v.
Break Even Margin
You will first need to
estimate the % variable and fixed costs for each cost category.
You can refer to problems 7-9 above for guidance as to
how.