
3.10.1 Investment Strategies: Application of the Degree of Operating Leverage
In a Barrons Article dated: September 6, 2010 they reported:
GOLDMAN'S ECONOMISTS SEE the U.S.
economy growing just 1.9% in 2011, compared with the 3% growth
rate forecast by many other firms. "The way to make money in
this environment is to wait for the consensus to move toward our
view," Kostin says.
He suggests buying stocks of companies with low operating
leverage, since a sluggish economy will make it harder for
companies to increase their revenue. The profits and margins of
companies with low operating leverage are more immune to
shrinking if and when revenue projections are cut. The average
operating leverage of the 25 companies in his basket of such
stocks is just 42% that of the S&P 500; the list includes
companies such as Walt Disney (DIS), Lorillard (LO), Rowan
(RDC), Cigna (CI), Precision Castparts (PCP), MasterCard (MA),
Visa (V) and Pactiv (PTV).
In this section, we explain the reasoning behind this statement, verify that the DOL of the companies is indeed low, and then show you the market performance of the companies since the Barron’s article.
Market View: Underlying Logic
Suppose we accept the view from Goldman then one can first ask is this investment strategy logic sound?
The degree of operating leverage is a measure of operating risk and a low degree of operating leverage implies lower sensitivity of EBIT to sales revenue growth. As a result, as pointed out by the Goldman analyst the EBIT margin is more immune to shrinking if and when the revenue projections are cut.
The first part of the quote asserts: "The way to make money in this environment is to wait for the consensus to move toward our view," Kostin says. Impilicitly this argues that the market has over weighted higher degree of operating leverage stocks and under weighted low degree of operating leverage stocks which is predicted to reverse if the consensus moves towards Goldman's view.
Trading Strategy
There are three parts to the above investment strategy:
A. Forecast about economic growth
B. Assessment of the degree of operating leverage (DOL)
C. Assessment of the market's overweighting high DOL stocks and underweighting low DOL stocks
A. Economy Wide Growth Forecasts:
Goldman's forecast was a reasonable because as you will learn in chapter 6, topic 6.12 is that real rates of growth for the US economy have been remarkably stable for over 100 years at 1.8%. In addition, there is a lot of useful information that can be extracted from the US Treasury yield curve relative to gorwth and inflation expectation trends (see Bondtutor.com). At the time of the Barrons article the implied inflation and real rates that are consistent with higher growth predictions were not supported by the yield curve. That is, their forecast was consistent with what could be inferred from the US Treasury Yield curve at that time.
Results for the US Economy 12-Months after the Barrons Article
The annual GDP adjusted for inflation was:
| Qtr | Year | Growth |
| 4 | 2010 | 0.031 |
| 1 | 2011 | 0.004 |
| 2 | 2011 | 0.013 |
| 3 | 2011 | 0.025 |
| Average | 0.01825 |
That is, the rate was remarkably close to the 1.9% forecast. That is, part A. of the strategy was met.
B. Low Degree of Operating Leverage Stocks
Eight stocks were named in the Barron's article. Of these eight seven were still trading 12-months later becuase one of those stocks, Pactiv (PTV) was acquired by the Reynold's Group. Pactiv (PTV) outperformed the market because it was acquired and a premium was paid as disclosed by the Pactiv Corporation in a news release:
Pactiv Agrees to be Acquired by Reynolds
Group Holdings Limited
Pactiv Shareholders to Receive $33.25 Per Share; Transaction
Valued at Approximately $6 Billion
LAKE FOREST, Ill. – August 17, 2010 – Pactiv Corporation (NYSE: PTV), a leader in the consumer and foodservice packaging markets, today announced it has entered into a definitive merger agreement to be acquired by Reynolds Group Holdings Limited, a leading global manufacturer and supplier of consumer food and beverage packaging and storage products headquartered in Chicago, Illinois, in a transaction valued at approximately $6 billion. Reynolds is a wholly owned subsidiary of New Zealand-based Rank Group Limited, which is owned by Graeme Hart.
Under the terms of the agreement, Pactiv shareholders will receive $33.25 in cash for each share of Pactiv common stock held, representing a premium of approximately 39 percent over Pactiv’s closing price of $23.97 on May 14, 2010, the last trading day prior to published reports regarding a potential transaction.
That is, irrespective of the DOL trading strategy investing in Pactiv paid off. We will not consider this stock in the following analysis.
Degree of Operating Leverage for Remaining Stocks Using Valuation Tutor
By first clicking on "Select Subset of Stocks" button in Valuation Tutor and then entering the remaining tickers (it will not find Pactiv, (Ticker: PTV)) as follows:
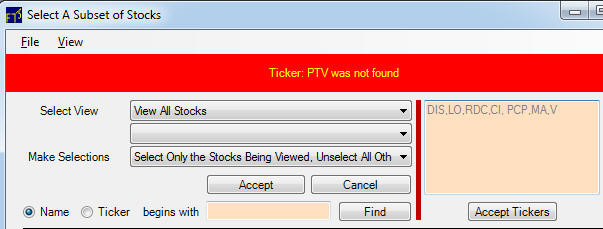
Click on Accept Tickers to accept and then select the Degree of Operating Leverage as highlighted below:
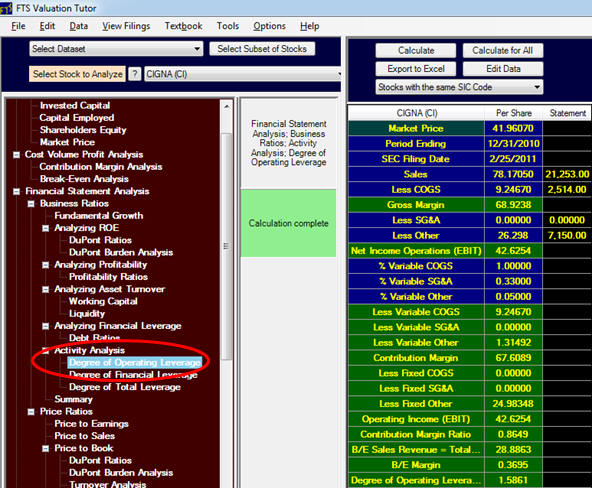
You can observe that for Cigna the DOL is low 1.58. By clicking on the "Calculate for All" button above this will perform these calculations for the subset of stocks selected:
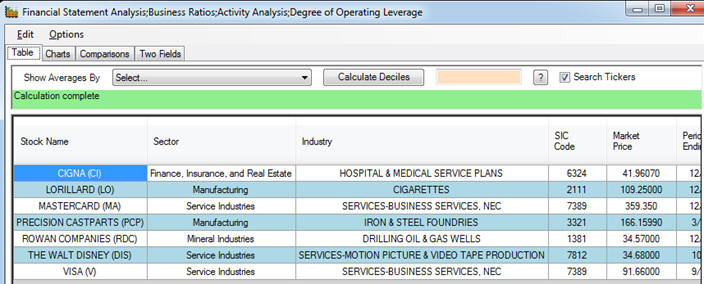
Further, by clicking on the Charts tab allows all DOL's to be represented graphically: In the graph below we have included Amazon (AMZN) which has a relatively higher DOL (> 4) compared to this subset of stocks (all DOL's < 2):
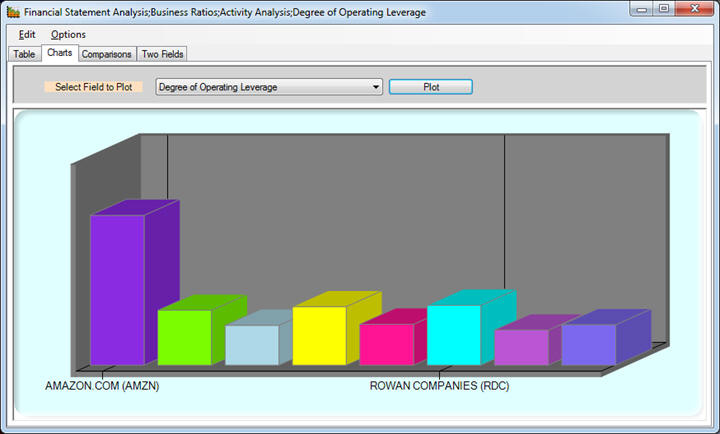
You can see that the set of Goldman stocks do indeed have relatively low DOL's.
C. Relative Market Behavior
Finally, recall the third part of the strategy assumed that low DOL's were being underweighted relative to high DOL's in the market. We check the market price behavior by plotting cumulative returns against the S&P500 index since the Barron's article:
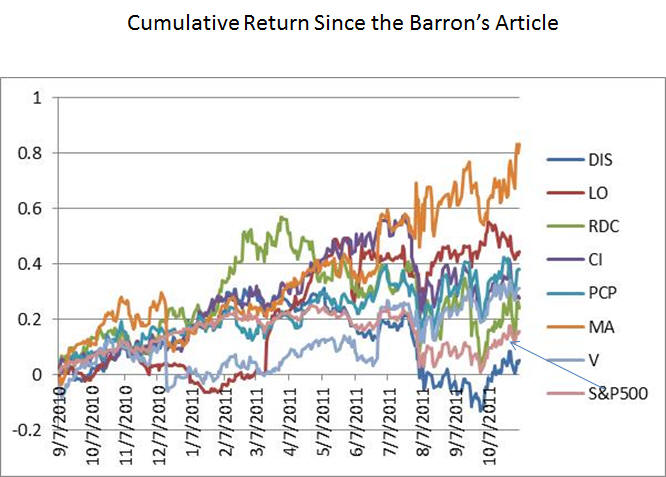
The prediction has done well in the market for all but Disney shares currently.