3.6 Profitability
Ratios
These ratios provide
immediate insight into how well management is running a
business. They
become especially meaningful in relation to competitors in the
same industry. Two
closely watched profitability ratios are:
Gross Profit Margin
= Gross Profit / Sales = (Sales – COGS)/Sales
Operating Profit
Margin = EBIT / Sales
Gross Margin is the
difference between a company's sales and cost of goods sold
scaled by Sales. The
higher the gross margin usually implies the higher priced its
goods and or services are.
For example, if two firms are operating at similar levels
of cost efficiencies but one has a higher gross margin than the
other this usually implies that the higher gross margin is
either charging higher prices or dealing with non commoditized
goods and services that carry a higher price tag.
Gross margin is not
required under US GAAP and therefore for most public companies
this is a derived number from the reported cost of goods sold.
Similarly, a firm’s Operating Margin measures the
performance of the firm’s primary business(es).
This includes not only the cost of goods sold but also
other costs associated with operations such as selling and
general administration.
Tutor Reconciliation:
Proctor and Gamble (PG)
Our objective is to reconcile the following from the 10-K:
Step 1:
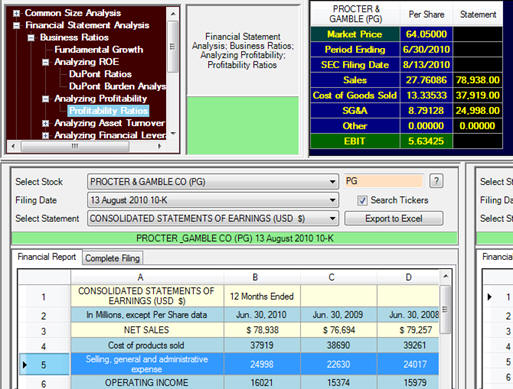
Bring up the Income Statement and Balance Sheet for
Proctor and Gamble as described in section 3.2.
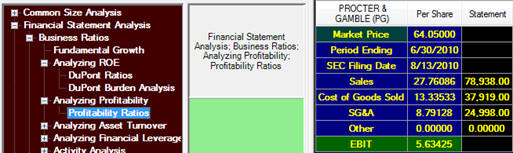
This was displayed at the bottom of the screen as
follows:
The above items deal mainly with the income statement apart from
the number of shares outstanding for expressing on a per share
basis.
You can stretch across a little the column 1 as displayed above
to make the labels more easily displayed and read.
For Proctor and Gamble you can see that the Gross Margin is not
directly provided but it is easily computed from the “Cost of
products sold” ($37,919) as P&G describe it.
Similarly, Net Sales are $78,938 and Operating Income
(EBIT) is $16,021.
Finally, the shares outstanding are provided from the
Shareholders’ Equity section of the Balance Sheet.
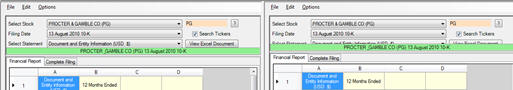
Step 2:
Click on Calculate and we can verify the input and
derived fields for the following:
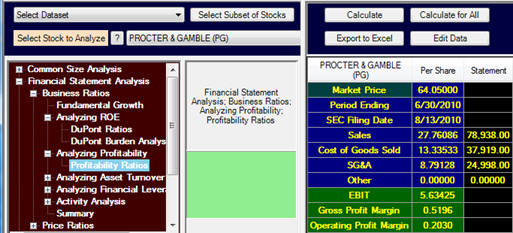
Sales per Share = 27.7609 per share
Cost of Goods Sold = 13.3353 per share
EBIT (Earnings Before Interest and Taxes) = 5.6343 per share
Derived:
Gross Profit Margin (Sales – COGS)/Sales = 0.5196
Operating Profit Margin =
0.203
In step 1 we extracted the aggregate numbers from the 10-K and
so the full reconciliation can now be traced through as follows: