
4.5 The Balanced Scorecard and Amazon.com
The Balanced Scorecard approach (Arthur Schneiderman (1987),
Kaplan and Norton (1992)) can be used within a firm as a method
for communicating business strategy.
It is a methodology that lets senior management
communicate and
implement business strategy at all levels of the
organization. When an
analyst outside the firm conducts financial statement analysis,
the Balanced Scorecard provides a framework for gaining a better
understanding of the firm’s business strategy.
Some important underlying themes to this approach are:
-
Describing business
strategy requires multiple dimensions because of the varying
emphasis given to different activities in the value chain
-
There needs to exist
some balance among these dimensions when an organization
implements its business model via its strategy.
-
Understanding major
firm decisions in terms of these multiple dimensions and
their balance is necessary for conducting meaningful
financial statement analysis.
Specifically, the Balanced Scorecard views the firm’s business
strategy from four perspectives:
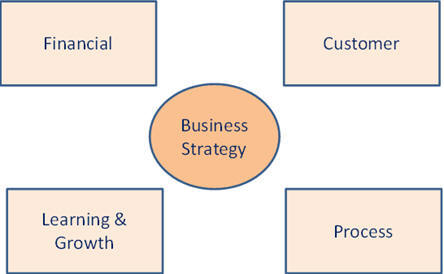
Application to Amazon.com
In the 1990’s and up to the time of hiring Galli, Amazon’s
business strategy was unbalanced from a balanced scorecard
perspective. In particular Amazon was over-emphasizing the
“Customer” and “Learning and Growth” to the detriment of the
“Financial” and “Process” dimensions.
The “Financial” perspective requires looking at measures that
are relevant to the valuation of the company by shareholders.
These include items like return on equity, return on assets, and
stock price. For Amazon the ROE was deteriorating from 1998 to
1999 and was not a meaningful measure in 2000 because both the
numerator (Net Income) and denominator (Shareholders’ Equity)
were negative by 2000.
As a result, the DuPont decomposition of ROA (Return on
Assets) provides a meaningful measure.
In particular, the drivers of ROA (Profit Margin Ratio
and Asset Turnover Ratio) were very unstable under the GBF and
Customer Obsession strategy no matter what it costs strategy
that was implemented in 1999.
However, these ratios started to stabilize after
traditional cost constraints were imposed via old economy
techniques such as implementing a traditional master budget
cycle at Amazon.
The “Process” perspective refers to the
internal activities
performed by a firm. This includes identifying activities for
which it is important for the firm to excel and captures what in
financial statement analysis is referred to as “business
efficiency.” The most relevant item here to Amazon around
1998-2000 was the inventory ratios, such inventory turnover and
days to sales inventory given Amazon’s warehousing expansion
plans that were implemented in 1999.
From 1998 to 1999 the days to sell inventory increased
from 22.61 days to 59.69 days a whopping 264% increase in the
time inventory stayed with Amazon.
With the amount of capital tied up in inventory and
warehouses it is not surprising that at this time Amazon’s
related working capital ratios were also out of balance with
days to pay payable increasing from 86.85 to to 125.27 days or
just over 4-months on average to pay their creditors in 1999.
The impact from imposing cost constraints upon their
business strategy was almost immediate.
In 2000 efficiency picked up and the days to sell
inventory were almost halved to 30.26 days and days to pay
payables were reduced to 84.13 which was around 1998 levels.
The “Learning and Growth” perspectives refer to employee and
informational activities requiring innovation and continual
improvement. For Amazon some relevant ratios are that Sales
growth did decline from 1999 to 2000 (from 269% in 1999 to 168%
in 2000) but 168% is still consistent with a strategy of GBF.
In addition, the DuPont decomposition revealed that asset
turnover was increasing which was a positive trend in the light
of Amazon undertaking a significant expansion into warehousing.
As a result, employees of Amazon had to go down the
learning curve along this dimension.
The positive trend in asset turnover provides evidence in
support of this dimension.
Finally, the “Customer” perspective requires the identification
of performance metrics that measure the company’s success in
meeting customers’ expectations
viewed from the customer
or outsider’s perspective. Direct information on these is
available in the supporting notes to the financial statements as
well as other parts of the 10-K.
For example, measures of customer service, customer
ratings, customer loyalty or retention.
For Amazon the word “customer” is used often in its 10-K.
Further, in the supporting notes to their 1999 financials
Amazon reveal the following metrics:
Amazon disclosed the following in their 2000 10-K footnotes to
the statements. This
description contains some performance metrics for the Customer’s
perspective:
Growth in net sales in 1999 and 1998 reflects a significant
increase in units sold due to the growth of our customer
base, repeat purchases from existing customers, increased
international sales, and the introduction of new product
offerings. These new product offerings include music and
DVD/video in June and November of 1998, respectively, toys
and electronics in July 1999 and home improvement, software
and video games in November 1999. We increased our issuance
of promotional gift certificates to customers in 1999 to
promote new product lines, however, which partially offset
such growth in net sales. The Company had approximately 16.9
million, 6.2 million and 1.5 million cumulative customer
accounts as of December 31, 1999, 1998 and 1997,
respectively. The percentage of orders by repeat customers
increased from 64% in the fourth quarter of 1998 to 73% in
the fourth quarter of 1999. The increase in net sales in
1998 was also partially due to the launch of the UK and
German focused Web sites in October 1998.
Amazon’s 2000 10-K was a little less forthcoming on the customer
dimension although they reinforced their strategy in many parts
of the 10-K. For
example:
U.S. Books, Music and DVD/Video Segment. The U.S. Books,
Music and DVD/video segment had net sales of $1.7 billion,
$1.3 billion and $588 million in 2000, 1999 and 1998,
respectively. During 2000, we continued to enhance our book,
music, DVD and video stores by expanding selection, making
it easier to find items, and generally improving the
customer experience. In 2000, our Book store had the largest
pre-order in our history. Over 410,000 copies of "Harry
Potter and the Goblet of Fire" were pre-ordered on our sites
worldwide. We joined with Federal Express to provide
complementary upgrades to the first 250,000 customers who
ordered to ensure delivery on the day of release. In
addition, we launched an e-Books store, offering e-books in
Microsoft Reader format for PCs and laptops, as well as
downloadable e- audiobooks from our strategic partner,
Audible, Inc.
In
summary, in 1999 Amazon pursued GBF and Customer obsession
without imposing cost constraints on their strategy.
As a result when viewed from a Growth and Customer
perspective Amazon looked great. On the other hand when viewed
from their Financial and Process perspectives Amazon did not
look so good awful.
So the implementation of their strategy was not in balance.
However, with the steps taken in 2000, significant
improvements were made in relation to both the Financial and
Process dimensions.
Ultimately, Amazon’s stock price reflected these steps.
Amazon has chosen to both perform similar activities to its
rivals but in different
ways. At the
time, most of its competitors were traditional “bricks and
mortar” stores.
Choosing to be a virtual store on the World Wide Web allowed
Amazon in principle to offer the “Earth’s Biggest Selection.”
Conceptually this
illustrates why Porter’s original description of a value chain
was extended to embrace the world of electronic commerce by
Rayport and Sviokla (1994). They observed that the traditional
value chain model treated information processing as a supporting
element of the value-adding process and not as a
source of value itself.
However, the information generated by customer-centric entities
is a source of value for customer centric businesses such as
Amazon and Netflix.
This activity is driven by databases and predictive algorithms
designed to make it easier for customers to find reliable
product and service ratings.
In this development Rayport and Sviokla view the value chain as
a pair of chains – the traditional physical chain operating in
the physical world of
marketplace and
a virtual (or synthetic) chain that operates in the new
information world referred to as
marketspace.
This categorization provides a better description of the
business model for technology firms such as Amazon, versus a
traditional bricks and mortar firms such as Wal-Mart and Barnes
and Noble who choose to extend their businesses to have a
presence in both spaces.
More recently Amazon has added to it’s revenue streams by
offering e-commerce services to sellers and developers some of
whom compete directly against Amazon.com.
This item reflects another interesting extension of
Porter’s original static framework to a dynamic and more
“chainlike” in terms of linking back to itself, value chain.
Dynamic Value Chains and Amazon
The difference between a static and
dynamic value chains is that in a dynamic chain different
entities assume different positions on the chain depending upon
things like the time of day and a customers’ location.
For example Amazon and third party suppliers compete with
each other on Amazon’s own platform.
The dynamic dimension of Amazon’s value chain is
communicated in Item 1 of Amazon’s 2010 10-K.
Here they report two additional parts of their business
model:
Sellers
We
offer programs that enable sellers to sell their products on
our websites and their own branded websites and to fulfill
orders through us. We are not the seller of record in these
transactions, but instead earn fixed fees, revenue share
fees, per-unit activity fees, or some combination thereof.
Developers
We
serve developers through Amazon Web Services, which provides
access to technology infrastructure that developers can use
to enable virtually any type of business.
That is, seller services and
order-fulfillment part of Amazon’s business essentially competes
with Amazon’s own sales and procurement teams.
Similarly, the Web Services division enables other
businesses to compete with Amazon and others.
These are examples of Amazon embracing a dynamic value
chain in their business model.
Dynamic Value Chains and Risk
The risk facing entities in today’s
dynamic value chains is that a company can suddenly
drop out of the chain.
This was a problem that Border’s bookstores faced when
competing against Amazon and Barnes and Noble.
Ironically, they were still the second largest “bricks
and mortar” bookstore when they lost their position in the
chain. This led to
the recent bankruptcy court events for Borders:.
July 22, 2011 a federal bankruptcy judge approved the
Borders Group’s plan to liquidate.
Borders at its height in 2003 operated 1,249
bookstores and 399 at the time of bankruptcy.
Both internal and external
factors are blamed for Border’s demise.
Clearly, online retailing and electronic book readers
were major factors.
For example, Border’s waited several years before it rolled out
it’s version of an e-reader called Kobo.
The other major “bricks-and-mortar” competitor, Barnes
and Noble, were much more proactive in their response to the
successes of Amazon’s Kindle.
Barnes and Noble developed it’s e-reader, the Nook which
today is competing successfully against the Kindle.
Borders also failed to
adapt to a dynamic external environment and badly timed their
expansion. They
expanded excessively around the same time period when Amazon was
generating significant performance gains from re-inventing the
implementation of their business model.
In addition, the world was rapidly embracing digital for
books, music and movies around this time.
Border’s ill-timed expansion resulted in relatively flat
sales along with rising costs.
The following table from a 2008 10-K reflects these
problems.
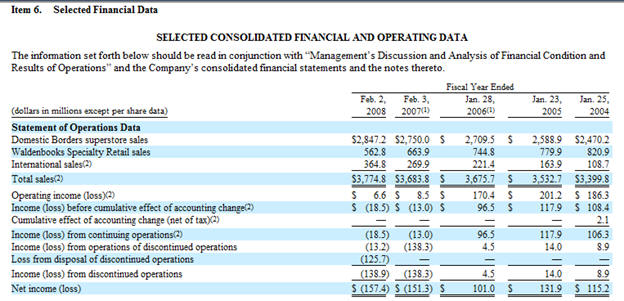
Source:
Borders 2008 10-K, Item 6