4.2 DuPont Analysis of Amazon.com
In the last chapter, we started with concept of fundamental or
accounting growth which is defined as:
Fundamental Growth = ROE * Retention Ratio
ROE is Net Income/Shareholders’ Equity and the Retention Ratio
is 1 – Dividend Payout Ratio.
Since Amazon paid no dividends, the retention ratio is
one, and therefore we will restrict our attention to the
Amazon’s ROE.
The DuPont decomposition of ROE is:
ROE = Net Income/Sales * Sales/Total Assets * Total
Assets/Shareholders’ Equity
This decomposition rewrites ROE as the product of three terms,
Profit Margin Ratio, Asset Turnover Ratio and Financial Leverage
respectively.
The following table shows the DuPont decomposition for
Amazon.com over its recent history.
We will look at some of the sub-components below.
Table 1:
Amazon’s DuPont decomposition history
Note that in 2000 – 2002 Amazon had a positive ROE but both the
numerator and the denominator were negative.
This is obviously is not a good sign but does reinforce
the loss of over 90% of shareholder value in 2000-2001.
The trend however reflected steady improvement which was
a good sign, also reflected in the stock price.
Amazon’s financial statements allow additional information to be
extracted. For
example, observe that Amazon’s Total Assets increased
significantly from 1998 to 1999.
To understand why requires digging further into Amazon’s
10-K report for information provided in addition to the major
financial statements.
You can use Valuation Tutor to access the historical 10-K for
Amazon. Select Amazon as
the stock to analyze, and in the Information Browser at the
bottom, click on 10-K and then scroll down to find the 2000 10-K
(filed in March of 2001):
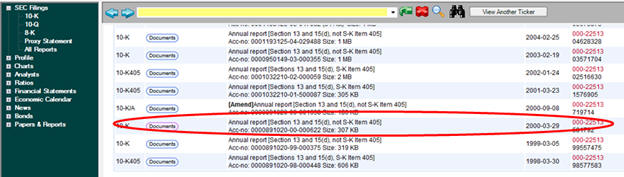
Amazon’s 2000 10-K filing covers the period of time ending
December 31, 1999 and is usually released in the first quarter
of the year.
Item 1 of the 2000 10-K reveals:
WAREHOUSING, INVENTORY, FULFILLMENT AND DISTRIBUTION
We significantly expanded our US distribution
infrastructure in 1999 with the addition of new distribution
facilities in Fernley, Nevada; Coffeyville, Kansas;
Campbellsville, Kentucky; Lexington, Kentucky; McDonough,
Georgia; and Grand Forks, North Dakota. We also opened two
new international distribution centers, one in the UK and
one in Germany. On an aggregate basis, these eight new
distribution centers comprised approximately four million
square feet of warehouse space. The geographic coverage of
these distribution centers and their capacity have
dramatically improved our fulfillment capabilities and will
allow us to continue to increase our volume. The new
distribution centers also give us more control over the
distribution process and facilitate our ability to deliver
merchandise to customers on a reliable and timely basis. We
now have a total of 10 distribution centers, including our
facilities in Seattle, Washington, and New Castle, Delaware.
In Item 1 they further observe that:
OUR SIGNIFICANT AMOUNT OF INDEBTEDNESS COULD AFFECT OUR
BUSINESS
We have significant indebtedness. As of December 31,
1999, we had indebtedness under senior discount notes,
convertible subordinated notes, capitalized lease
obligations and other asset financing totaling approximately
$1.48 billion. With the sale of our Premium Adjustable
Convertible Securities(TM), also known as PEACS, in February
2000, we incurred additional debt of approximately $681
million. We may incur substantial additional debt in the
future. :
That is,
Amazon’s investment decision had a significant impact upon its
financial statements.
In particular, the expansion of assets and debt combined
with a significant jump in negative income led to Amazon’s
stockholders’ equity turning negative by 2000.
Armed
with this background information we can return to the DuPont
decomposition for Amazon and how it changed over time.
Applying DuPont Decomposition to Amazon
The
DuPont decomposition lets you track three important ratios:
Profitability
Asset
Utilization
Financial
Leverage
Each of
these three items is key to understanding Amazon’s performance,
especially in light of the significant warehousing investments
made in 1999 that were funded by debt incurred in 1999 and 2000.
Profitability
First,
consider profitability. From
1995 to 2000, there was a “dot com bubble”
where shares of internet companies rose to very high
levels. Many of
these companies did not generate any profits, and Amazon.com was
no exception to this, as described in a colorful manner in the
Fortune Magazine article, as follows:
(FORTUNE Magazine) –
A year ago, getting Jeff Bezos to talk about making money
was a bit like getting Bill Clinton to define sex. Last
fall, when asked when he thought Amazon.com would turn a
profit, he hemmed, hawed, and mumbled something about not
"missing out on the big opportunities of the Internet."
Pressed further, he gave this murky response: "Look at USA
Today; it took 11 years to become profitable."
Beautiful Dreamer, Katrina Brooker,
Fortune Magazine Dec 18, 2000.
It turned out that Bezos was correct
as the following profit margin trends show.
In the chart below you can see that the profit margin
fluctuated wildly in the early years and then ultimately settled
down into a more normal range.
Table 1 reveals how negative net income was.
However, by 2002 Amazon’s profit margin is signaling a
significant change.
It ultimately stabilized in the latter the latter part of the
decade.
Amazon’s
profit margin behavior suggests that the 1999 asset expansion
ultimately proved to be worthwhile for Amazon’s shareholders.
Asset Turnover
The
second major term in the DuPont decomposition asks: how
efficiently assets are being utilized in the company.
The Asset Turnover ratio is calculated by dividing Sales
Revenue by Total Assets.
This ratio provides insight into how efficiently assets
are being utilized to generate sales revenue.
The chart
reveals a positive trend over the early years.
That is, Amazon appears to be learning to utilize its
assets more efficiently during the first decade of the 21st
century. This graph
strongly reinforces Amazon’s decision to expand its warehousing
capability in 1999 as this proved to be important for supporting
the growth in sales exhibited by Amazon (see Table 1).
In addition, the combination of the positive asset
utilization trends with the positive trends in profit margins
provided even stronger reinforcement of the investment decision
made in 1999 and it was not until the economic crisis of
2008/2009 that any real change in trends occurred.
However,
the investment decision did add a considerable amount of debt to
Amazon’s Balance Sheet and so the third major component of the
DuPont decomposition provides insight into how this is reflected
in the financial statements.
Financial Leverage
Finally,
ROE is the product of ROA and Financial Leverage and financial
leverage reflects Amazon’s debt policy.
Financial Leverage only makes sense for firms that have
positive shareholders equity and so the blanks parts in the
graph below correspond to the times Amazon had a negative
shareholders’ equity.
Recall
that Amazon introduced some significant debt when it invested in
its own warehouses.
For example, Amazon’s 2000 10-K reveals that from 1998 to 1999
Amazon’s debt increased significantly:
1998
1999
2000
Long-term
Debt
348,140
1,466,338
2,127,464
The
increasing debt, combined with increasing losses, drove Amazon’s
shareholder equity to be negative.
It took until 2005 before Amazon recorded a positive
shareholders’ equity and the graph depicts a significant
improving trend in financial leverage as Amazon was building up
retained earnings and paying down its debt.