
4.15 Example:
Interpreting Degree of Operating Leverage
Suppose
Wal-Mart’s TTM Sales are expected to increase by 5% and fixed
costs remain unchanged.
By how much do Operating Earnings change by?
You can
verify that Operating Income has increased by 14.935% = Sales
Growth *DOL = 5*2.987.
Now
consider what actually happened from 2008 to 2009.
Actual sales revenue increased by only 0.95% for Wal-Mart
and 0.63% for Target.
As a result, the predicted increase in operating income
is 3.21% growth for Wal-Mart and 2.37% for Target.
The actual versus predicted is provided below:
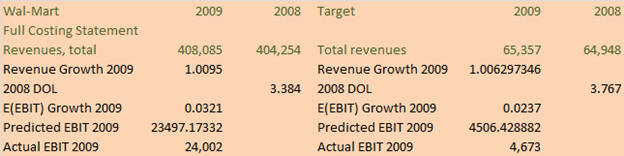
Both
companies outperformed this prediction.
It is instructive to understand how.
It should
be noted, however, that this assumes that fixed and variable
costs remain unchanged under the increased sales growth.
For example, both Target and Wal-Mart attained better
COGS in 2009 compared to 2008.
That is, after the economic crisis it appears that
procurement for both companies were able to negotiate more
aggressive terms.
To get to
the bottom line, however, requires one additional step which is
to understand the impact of financial leverage.