
4.14 Analyzing
Capacity Activity and Productivity
First we
need to convert the gross margin form of the income statement to
a variable costing for both Wal-Mart and Target.
Note:
Valuation Tutor requires
you to specify the percentage of the total that is allocated to
variable costs, with fixed costs making up the remainder.
For a retailer we expect the majority of COGS to be a
variable cost because they are turning over inventory at a quick
rate as revealed in the working capital analysis.
So we will assume the allocation is 100% variable for
COGS. For SG&A we
will assume a traditional 30% variable.
and for other costs these are generally fixed so we will
assume 5% variable for other.
Armed
with these assumptions we can convert the income statement into
a variable form. The
table below contains both full costing and variable costing
forms of the income statement.
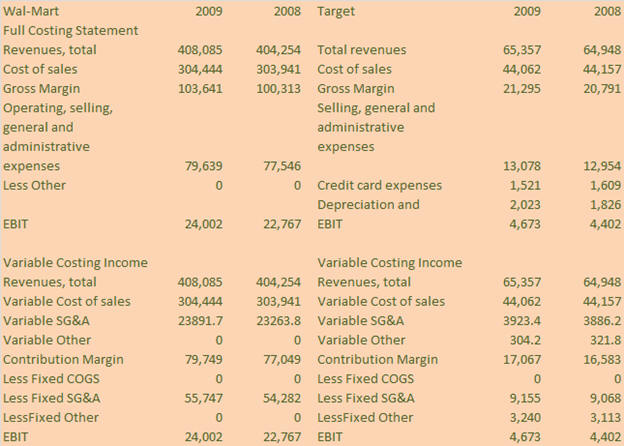
Notes:
Variable
COGS = 100% of COGS
Variable
SG&A = 30% of SG&A
Variable
Credit card expenses Target = 20%
Depreciation and amortization Target 100% fixed
In the
above we allow for the fact that Target has one additional line
item “Other” which is primarily fixed cost.
Observe that the fixed component of both costs is a
little higher for Target than Wal-Mart.
Finally,
a firm’s operating leverage is defined as the percentage change
in the firm’s operating earnings (EBIT less any non-operating
income), that accompanies a percentage change in the
contribution margin.
That is, the operating income elasticity with respect to the
contribution margin.
In other words, this tells an analyst that a percentage change
in sales revenue will result in a percentage change in operating
earnings. This is a
useful number to estimate especially as the consensus sales
revenue forecast is readily available in the form of high, low
and average which can then be related to earnings forecasts via
the following relationship:
Degree of Operating Leverage (DOL) = % Change in operating
income/% Change in sales revenue
Equivalently,
Degree of Operating Leverage (DOL) = Contribution
margin/EBIT
This
important measure reflects the fact that a change in Sales can
lead to a more than proportional change in earnings from
operations. In
particular, the higher the degree of operating leverage the
higher the predicted change.
However, the relative size of the Degree of Operating
Leverage is affected by how close the firm is to their
break-even point.
The closer the higher is the DOL.
Contribution Margin Ratio = Contribution Margin/Sales
Revenue
Contribution Margin Ratio = (Sales Revenue – Total Variable
Costs)/Sales Revenue
Break Even (B/E) Analysis ($Sales Revenue)
= Total Fixed Costs/(Contribution Margin Ratio)
Break Even (B/E) Margin = B/E $Sales Revenue/$Sales Revenue
From the
above variable costing income statement for the year ending:
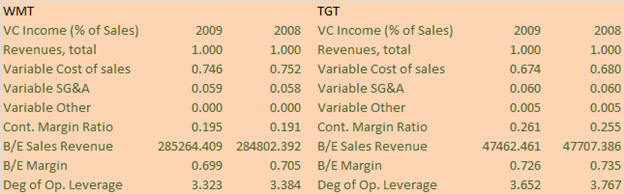
Wal-Mart 2009
Contribution Margin Ratio (CMR) = 0.195
Break-even (B/E) Sales Revenue = Total Fixed Costs/CMR =
$285,264
Break-even (B/E) Margin = 0.699
Degree of Operating Leverage = 3.323
Target 2009
Contribution Margin Ratio (CMR) = 0.261
Break-even (B/E) Sales Revenue = Total Fixed Costs/CMR =
$47,462
Break-even (B/E) Margin = 0.726
Degree of Operating Leverage = 3.652
In the
above example observe that Target has a higher contribution
margin than does Wal-Mart.
Thus all other things being equal Target is prepared to
spend more on advertising because the dollar contribution from
increased sales is higher.
However, observe the degree of operating leverage is
higher for Wal-Mart than Target.
This implies increasing advertising expenditure to
increase sales will have a greater impact on Operating Income
for Wal-Mart than Target.
That is, the latter measure takes into account both fixed
and variable costs.
Income from Operations is an important number in later
assessments of intrinsic value.
As a result, it is a number that provides a broader
measure of expenditures upon a firm’s assessed value.