
4.18 Growth
and Degree of Total Leverage
This number relates a firm’s operating and financial leverage to
its net income.
With respect to Net Income:
Degree of Total Leverage = % Change in Net Income /% Change
in Sales
In terms of the Contribution Margin format of the Income
Statement this is:
Degree of Total Leverage = Contribution Margin/Net Income =
Contribution Margin/EBIT * EBIT/Net Income
Degree of Total Leverage
= Degree
of Operating Leverage * Degree of Financial Leverage
For Wal-Mart and Target collecting together parts of the above
analysis:
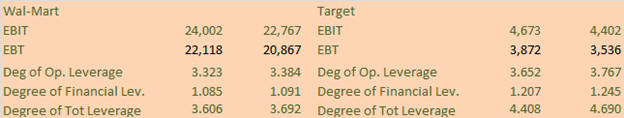
Wal-Mart:
TTM Degree of Operating Leverage = 3.32
Target: TTM
Degree of Operating Leverage = 3.65
Wal-Mart:
TTM Degree of Financial Leverage = 1.085
Target: TTM
Degree of Financial Leverage = 1.207
Wal-Mart:
TTM Degree of Total Leverage =3.606
Target: TTM
Degree of Total Leverage = 4.408
Target as revealed above carries more financial leverage and
therefore it is more sensitive to sales fluctuations than is
Wal-Mart. Recall
from the price chart (repeated below for your convenience) that
Target is more sensitive to the business cycle than is a
“Wal-Mart.”
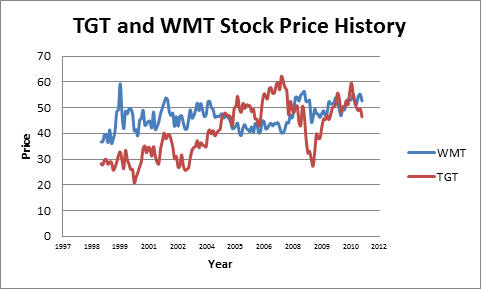
The degree of total leverage analysis above reinforces the
conclusion that Target is riskier than Wal-Mart because of its
greater operating and financing leverage.