
4.16 Analyzing
Financial Leverage
It is an
open question whether the financing decision adds value to
shareholders or not.
We will make two observations here.
First, we will see that increasing financial leverage has
a positive impact upon ROE.
However, it also increases risk and so equity investors
will require a higher rate of return.
If this higher rate of return exactly offsets the
positive impact from financial leverage then it is all awash and
the financing decision has no impact upon shareholder value.
If the financing decision interacts with the investment
decision, for example as per a financial institution then the
financing decision matters.
We now
examine how both Wal-Mart and Target have approached the
financing decision.
Example: Wal-Mart
versus Target
As a
first pass the DuPont analysis and the Debt Ratio reinforce the
conclusion that Target is carrying more leverage than Wal-Mart
although Target appears to be currently reducing its leverage to
bring it more in line with Wal-Mart’s.
However,
to focus more sharply upon the firm’s financing decision the
Debt ratio is further refined into the Debt to Equity Ratio
which traditionally is expressed as:
Debt to Equity Ratio = (Long-Term Debt + Value of
Leases)/Shareholders Equity
Long Term Debt to Equity Ratio = Long-Term Debt/Shareholders
Equity
However,
in today’s world traditional financing approaches have changed
significantly with the use of derivatives and in particular
interest rate swaps.
As a result, much financing is done short term and then swapped
into desirable long term patterns using interest rate swaps that
can extend out to 30-years.
This implies that the Debt to Equity and the Long Term
Debt Ratios be redefined to include
short term debt.
Debt to Equity Ratio = (Total Debt + Value of
Leases)/Shareholders Equity
Term Debt to Equity Ratio = Debt Issued / Shareholders
Equity
The above
ratios provide insight into the extent of debt leverage for the
firm and immediately raise questions regarding the amount of
interest coverage the firm has.
The first ratio is relevant to a traditionally financed
firm that matches long term investment with long term financing
and the second ratio is relevant to a modern firm that exploits
derivatives and swaps to manage its financing decision.
Both
firms exhibit a business model built around ownership as opposed
to leasing. This is
reinforced from the following excerpts from their respective
10-K’s:
Wal-Mart 2010 10-K
ITEM 2. PROPERTIES
The number of discount stores, supercenters, Neighborhood
Markets and Sam’s Clubs located in each state in the United
States and the number of units located in each of the
countries in which we operate are disclosed as of fiscal
year-end January 31, 2010 in our Annual Report to
Shareholders under the caption “Fiscal 2010 End-of-Year
Store Count” and are incorporated herein by reference.
Portions of such Annual Report to Shareholders are included
as an exhibit to this Annual Report on Form 10-K.
United States.
As of January 31, 2010, in the United States, we
owned 3,214 of the buildings in which discount stores,
supercenters and Neighborhood Markets operated and 483 of
the buildings in which our Sam’s Clubs operated. Land on
which our stores are located is either owned or leased by
the company. In the United States, we lease the remaining
buildings in which our stores and clubs operate from either
commercial property developers pursuant to capital or
operating lease arrangements or from local governmental
entities in connection with industrial revenue bond
financing arrangements. All store leases provide for annual
rentals, some of which escalate during the original lease
term. In some cases, the leases provide for additional rent
based on sales volume. Substantially all of the company’s
store and club leases have renewal options, some of which
include escalation clauses causing an increase in rents.
International.
We operate our International segment stores and
restaurants in a combination of owned and leased properties
in each country in which our International segment operates.
As of the end of fiscal 2010, we owned 33 properties in
Argentina, 161 properties in Brazil, 117 properties in
Canada, 125 properties in Chile, 1 property in China, 69
properties in Costa Rica, 9 properties in El Salvador, 14
properties in Guatemala, 7 properties in Honduras, 52
properties in Japan, 530 properties in Mexico, 25 properties
in Nicaragua, 11 properties in Puerto Rico and 239
properties in the United Kingdom. The remaining operating
units in each such country are leased on terms that vary
from property to property. We utilize both owned and leased
properties for office facilities in each country in which we
are conducting business. As of the end of fiscal 2010, our
International operations are supported by 132 distribution
facilities. Of these 132 distribution facilities, we owned
and operated 34 and leased and operated 37. Third parties
owned and operated the remaining 61 distribution facilities.
Target 2010 10-K
The following table summarizes the number of owned or leased
stores and distribution centers at January 30, 2010:
(a)
Properties within the "combined" category are
primarily owned buildings on leased land.
(b) The 38
distribution centers have a total of 48,588 thousand square
feet.
As a
result, for the debt ratios we will compute relative to Debt and
ignore leases. The
degree of Financial Leverage in terms of Net Income as follows:
Degree of Financial Leverage = EBIT/EBT
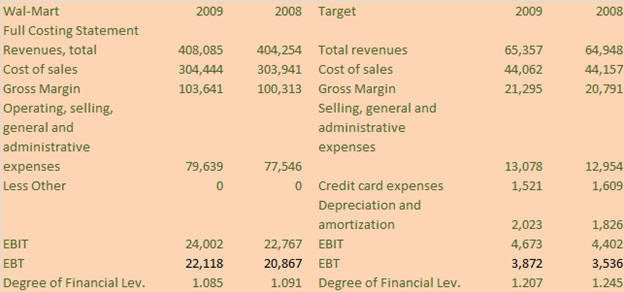
Wal-Mart 2009
Operating Income =
$24,002
Earnings Before Tax = $22,118
Degree of Financial Leverage = 1.085
Target 2009
Operating Income
= $4,673
Earnings Before Tax = $3872
Degree of Financial Leverage = 1.207
The above
is revealing of differences in the two firm’s financing
strategies whereby Target has a higher degree of financial
leverage than does Wal-Mart.