
2.3 Accessing Interactive Data through Valuation Tutor
You
can see that financial reports today provide large amounts of
detail. We now show you
how easily you can access this data in Valuation Tutor.
Specifically, we will conduct the following exercise, which
also shows you how to extract data that you are interested in:
Compare the Sales Revenue for
Amazon.com, Wal-Mart, Target and Sears, over the last three years.
Further, transfer this information into Excel.
Step 1:
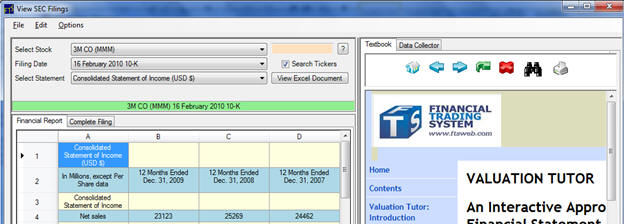
Launch Valuation Tutor and click on Access SEC filings:

This provides immediate and convenient access to all the Interactive
Reports:
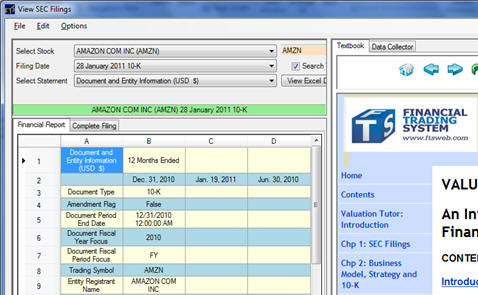
We will focus on AMZN (Amazon.com), WMT (Wal-Mart), TGT (Target) and
Sears (SHLD). By
selecting the stock from the dropdown (or entering the stock ticker
AMZN and clicking “?”), all of Amazon’s interactive filings are
shown by filing date.
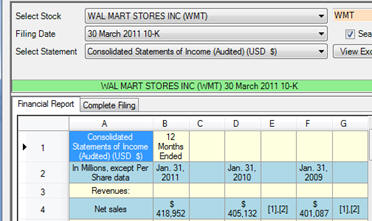
We will select the latest 10-K, which, at the time of this writing,
was filed in January 2011:
 :
:
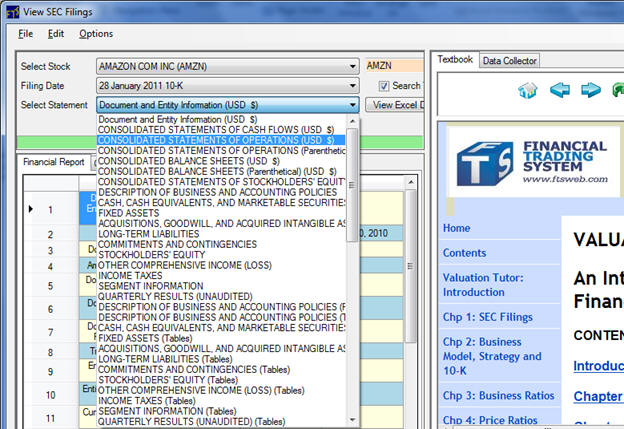
From the dropdown next to “Select Statement,” you can see that there
are many parts to the 10-K.
We will select the Consolidated Income Statement (called the
Consolidated Statement of Operations by Amazon.com).
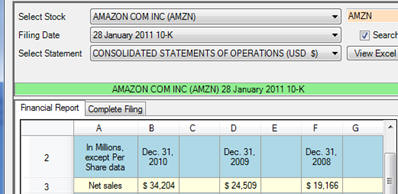
You can see that Amazon has experienced strong sales growth over the
last three years which includes the period of time covered by the
financial crisis of 2008 and the subsequent recession:
By comparison, Wal-Mart’s sales growth was positive but nowhere near
as impressive as Amazon’s:

TGT’s sales also exhibited positive, but smaller growth than
Wal-Mart:
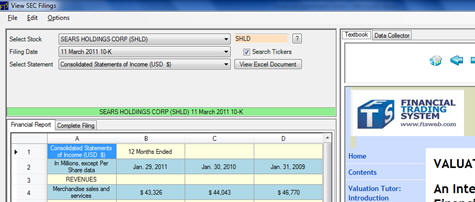
Sears, on the other hand, has suffered from declining sales revenue
over this same time period:
Step 2:
Extracting Data into
Excel
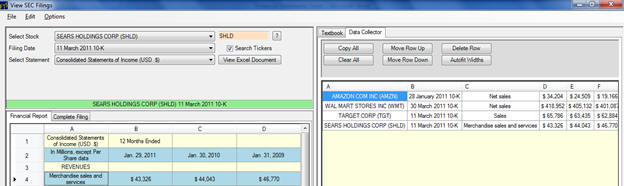
Beside the tab “Textbook” (top right hand side) observe the tab
“Data Collector.” We
will now show you how to collect the data in a convenient form.
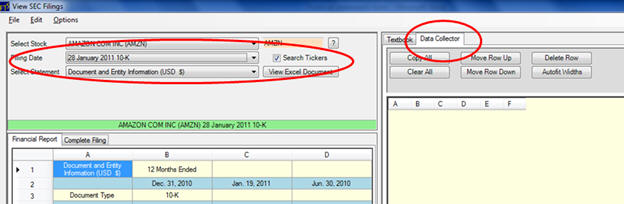
Enter the stock ticker AMZN (for Amazon.com), select the 2011 10-K
from the Filing Date dropdown and finally click on the “Data
Collector” tab. Now you
are ready to collect data from each of the financial statements.
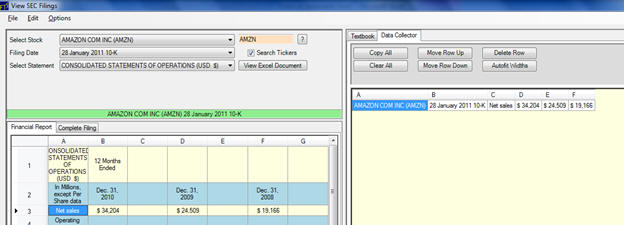
Next select:
Consolidated Statement of Operations (USD $) and double click the
cell Net Sales – you can add additional cells if you wanted to but
we will keep this simple and stick with Net Sales:
For the remaining companies just repeat the above steps so that you
end up with the screen below.
Don’t forget you only need type in the ticker each time in
the above box --- so first type WMT and select the 2011 10-K and the
Consolidated Income Statement and then double click beside Sales
etc.,. After a few
clicks you have collected the following information:
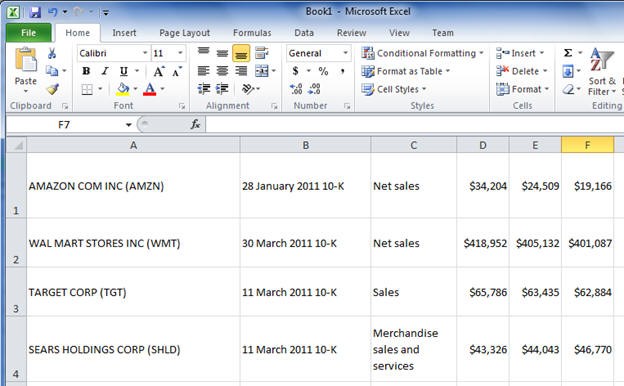
To transfer into Excel merely click on Copy All and then paste to
Excel. You are now
ready for additional analysis:
The above demonstrates the power of interactive data.
Valuation Tutor lets you mix and match across statements,
across financial statements and collecting multiple fields that do
not need to be sequential.
You will find that Data Collector provides a powerful utility
that you can use in conjunction with Excel.