
A.1
Appendix:
A Quick Tour of the Balance Sheet
A.1: Consolidated
Balance Sheet (Example: Amazon, Jan 2011 10-K)
This statement provides the primary source of information relevant
to assessing the capital resources that a company controls.
It shows the financial position -- assets, liabilities and
stockholders' equity on a particular date.
The formal structure of the Balance sheet at a point in time
is:
Assets - Liabilities = Owners Equity
That is what resources are available less what obligations the
entity has equals the owners’ residual claims.
That is, if you purchased this entity the balance sheet
provides the set of resources you gain control over plus the set of
obligations or liabilities that you have assumed.
The balance sheet results from classifying every transactions
relative to the fundamental accounting equation.
That is, the balance sheet results from the following types
of transactions:
o
Assets increase, Assets decrease
o
Assets increase, Equities increase
o
Equities decrease, Equities increase
o
Equities decrease, Assets decrease
o
Assets and equities increase or decrease by the same amount
In each case the equality is maintained.
For example suppose Wal-Mart purchase inventory for cash to
sell in their stores.
Inventory is an asset and so assets increase.
Cash is an asset that is decreased and thus the net effect is
unchanged leaving the fundamental equation unchanged.
Other transactions may result in increasing the two sides of
the above equation by the same amount.
For example, suppose Wal-Mart sell this inventory for cash at
a higher price than what they paid for it.
Now the cash asset increases more than the inventory asset
decreases which requires for equality to be restored by adding the
difference (referred to as the profit) to the right hand side of the
equation in retained earnings an owners’ equity account.
One could ask do any transactions exist that only have a single
effect?
The answer is no because
the accounting equation is a binding constraint and therefore the
accounting equation identifies the appropriate offset for
every transaction.
In other words double entry accounting flows naturally from
the accounting equation that defines the balance sheet.
For example, paying a cash dividend may appear to fall into a
possible single effect category because cash is paid out.
So what is the offsetting entry?
The answer to this is that because cash is paid out to the
owners this reduces owners’ equity and thus cash dividends reduce
assets and reduce owners’ equity (retained earnings).
Balance Sheet Classifications and Major Firm Decisions
In the balance sheet assets provide future services to the firm.
They are classified into Current and Non-Current Assets if
their service potential is short term (either 1-year or one
operating cycle if the latter is greater than 1-year).
The Operating cycle is defined as the time to purchase or
manufacture inventory, sell the product and collect the cash.
The operating cycle is short for the case of perishables
such as food, seafood, fruit and relatively short in consumer goods
industries. It is
slower in capital goods industries and relatively long for products
such as distilleries and wine.
As a result, in these industries the one operating period
rule sometimes applies.
Non-current assets reflect investments the firm has made into capacity and related items so that their service potential to the firm extends over longer periods of time. Similarly, Liabilities are classified into Current and Non-Current based upon the time of the obligation’s expected due date. Obligations can arise from operations such as accounts payable, from investing activities and financing activities the entity is involved in. Finally, the owners or stockholders’ equity part of the balance sheet results from transactions involving shareholders such as new equity financing or company purchases of their own stock (Treasury stock purchases) as well as activities not involving shareholders but the shareholders benefit from. For example, income generating activities, foreign currency fluctuations, pension accounting and fair value accounting. An example is provided below for Amazon.com.
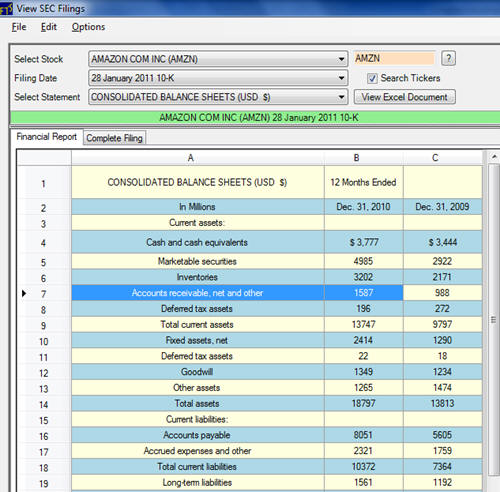
Amazon present their balance sheet in a relatively simple form
compared to most other companies.
They provide their additional details in separate support
statements. For
example, suppose an analyst wanted to see what the above reported
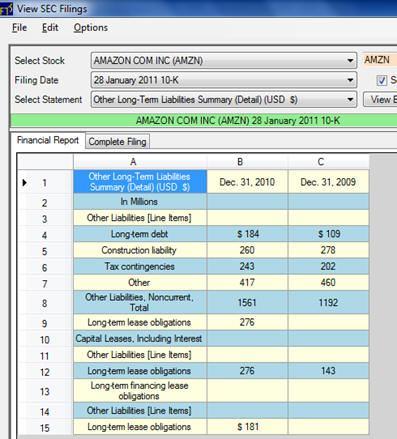
number for “Long Term Liabilities” $1561 (millions) consist of?
For Amazon this is in the support statement (“Other Long-Term Liabilities Summary (Detail) (USD $)”):
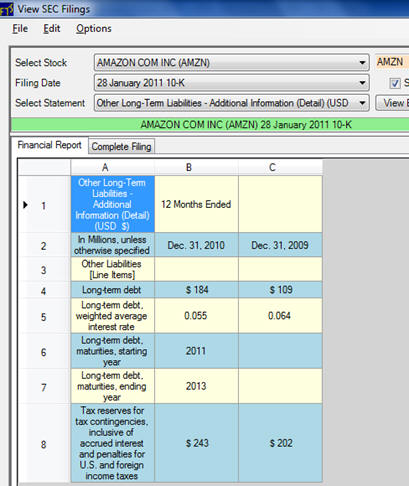
Further details are available about Amazon’s Long Term Debt including the weighted-average interest rate as follows:
Online, you can also drill down into Amazon’s lease obligations by
selecting the statement “Long-Term Capital Lease Obligations
(Detail) (USD $)”:
The Stockholders Equity is provided below to preserve links between
the two balance sheets across time.
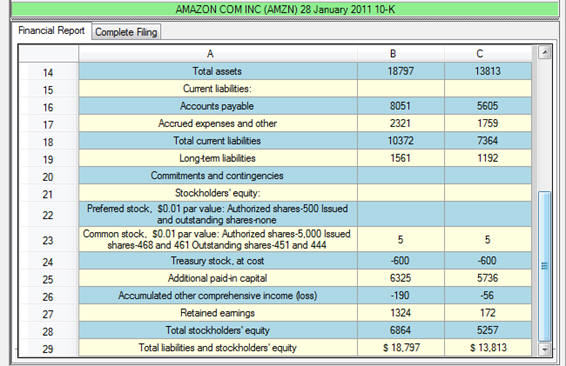
In a separate topic we will work through the details of the
stockholders’ equity section of the balance sheet.
This is because this area is sufficiently complex that today
it is expanded into the fourth primary statement referred to as the
“Consolidated Statement of Stockholders’ Equity.”
Next, we consider some of the typical line items in a Consolidated
Balance sheet.
Elements of the Balance sheet
Current Assets
US GAAP requires listing in order of liquidity and it includes the
following major categories:
Cash and Marketable Securities (Category:
Cash)
Cash and cash substitutes, relatively riskless and easily converted
to cash. Marketable
securities are short term investments that are initially recorded at
cost. However, US GAAP
(FAS 115) categorizes marketable securities into three categories;
Trading, Available for Sale, Held to Maturity.
To categorize as “Held to Maturity” the firm must have
‘positive intent and ability’ to hold until maturity.
Marketable securities held for trading are common for
financial institutions.
In addition, for all institutions there are some financial
securities that are deemed to be Held-for-Trading irrespective of
intent. These are
derivatives that do not qualify as a hedge under US GAAP.
Finally, any security that is neither classified as “Trading” or
“Held to Maturity,” are deemed to be “Available for Sale.”
The classification matters for how it is measured on the
balance sheet relative to recognizing unrealized gains and losses.
In particular,
•
Held to maturity
– These are measured on the balance sheet at amortized cost.
•
Trading securities
– These securities are reported at fair (market) value with
unrealized gains and losses reported in the accounting income
statement (covered in a later topic).
•
Available for Sale
– These securities are neither “Held-to-Maturity” or for “Trading.”
Available-for-Sale securities are reported at fair value with
unrealized gains and losses reported in the Consolidated Statement
of Stockholders’ Equity (covered in a later topic).
It is noted that accounting for financial assets reflects fair value
accounting and is one of those rare examples of where the
recognition of unrealized
gains is permitted.
Of course the recognition of unrealized losses is common in both
historical cost and fair value accounting.
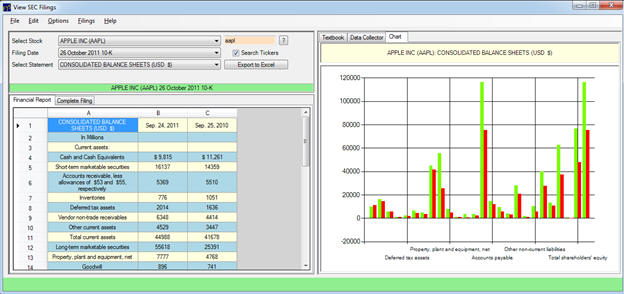
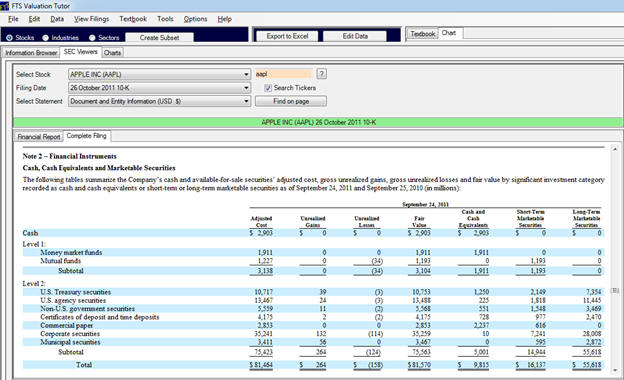
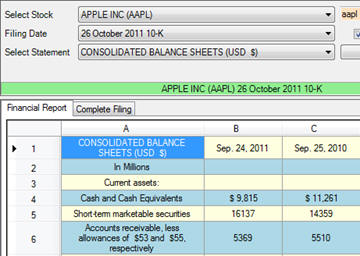
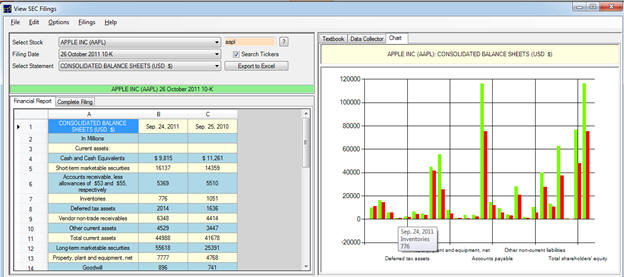
Financial assets on today’s balance sheet can be very large.
The example below illustrates this for Apple (in millions):
The breakdown of this category for large firms is provided in their
footnotes to the account:
The next set of account groupings fall into the category of working
capital. Working
Capital measures the operating liquidity of a firm and results from
managing a firm’s short term assets and liabilities that relate to
the firm’s operations.
Major items include:
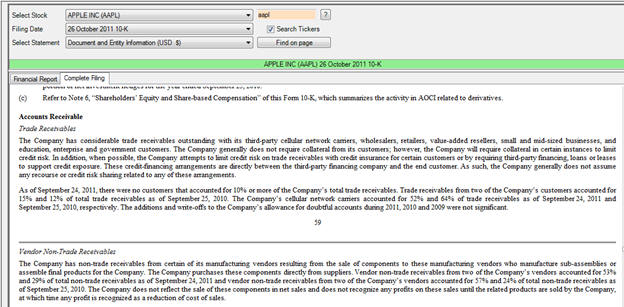
Accounts Receivable (Category:
Operating)
This records the outstanding balance from credit sales and is
recorded at their net realizable value.
That is, an allowance is made for doubtful debts.
Again important details associated with the Accounts Receivable are
provided in the footnotes to the accounts.
Inventory (Category:
Operating)
This records items that held for sale or used to manufacture
products to be sold.
The measurement of inventory reflects the underlying cost flow
assumption which under US GAAP can be FIFO (first-in, first-out),
LIFO (last in, last out), weighted average cost or specific
identification. Under
IFRS only FIFO the weighted average cost flow assumptions are
permitted. The cost
flow assumption for accounting purposes can be different from the
actual physical flow of inventory and in times of inflation the cost
flow assumption makes a significant difference to net income
measurement. That is,
LIFO reduces income but also reduces taxable income in times of
inflation relative to FIFO.
Analysts look at the change in inventory over the period to check
whether inventory is building up or running down.
When product is moving fast inventory declines as can be seen
from Apple’s results below:
Prepaid Expenses (Category:
Operating)
Not all current assets are converted to cash.
Prepaid expenses represent one class that does not convert to
cash but they do have service potential that will be consumed within
the year. Typically
these are insurance, rent, property taxes and utilities.
Deferred Taxes (Category:
Operating)
This item can appear as a current asset in a balance sheet.
It arises because accounting net income and taxable income
are different. For
example, in taxable income there can be effects from net loss
carryovers from previous periods which are classified as assets when
it is determined that there is a greater than 50% chance of being
able to be used in future fiscal periods.
As a result, differences
between accounting and taxable income can be classified as either
“temporary” or “permanent.”
Deferred taxes arise from
temporary differences in
the recognition for taxable income and this can create either an
asset or a liability on the balance sheet.
Deferred taxes in the “current” part of the balance sheet reconciles
the differences for the current accounting period between the
reported tax expense and the cash paid for taxes to the IRS.
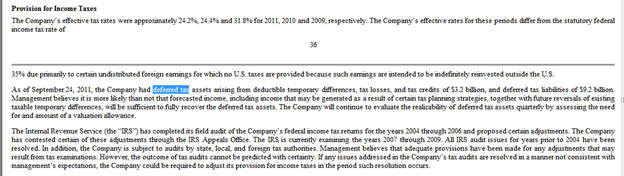
Apple Example:
Again it is in the footnotes to the accounts that spell out the
differences as illustrated for Apple below.
Non-Current Assets
Property, Plant and Equipment (PPE) (Category:
Investing)
These items represent the firm’s capacity to provide service for
more than one year.
These items are depreciated over time and management has much
discretion with respect to their choice of depreciation methods.
Briefly the three major types are referred to as straight
line, accelerated and units of production.
Noncurrent assets are cleverly defined as anything not classified as
a current asset. The main line items in this section are long-term
investments; property, plant, and equipment (PP&E); and goodwill and
other intangible assets.
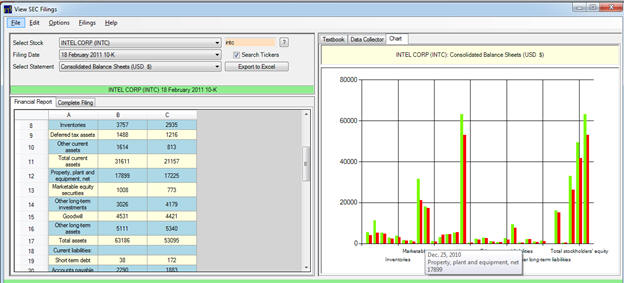
The relative size of PPE depends upon the firm’s business model and
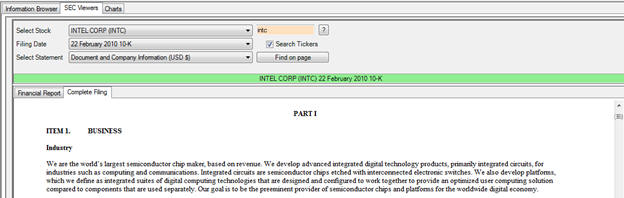
it is instructive to illustrate this for Apple versus Intel.
Intel produces chips and there products whereas Apple focuses
upon interface and excels at interface with the human user.
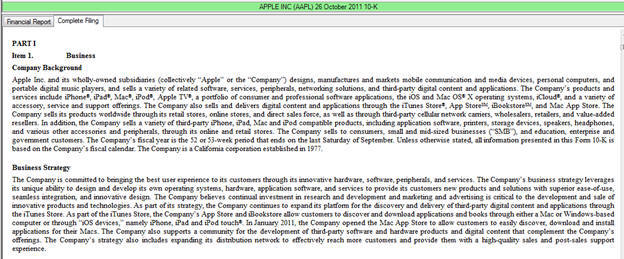
Such differences will appear both in Item 1 of the 10-K as
well as their respective balance sheets:
Example: Apple versus
Intel
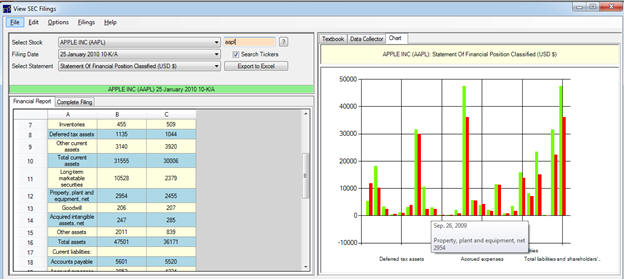
The graph reveals the relative small size of PPE to other Balance
Sheet items for Apple.
Now compare this to the large relative size of PPE for Intel.
This is consistent with its business model:
Leases (Category:
Investing)
Under both US GAAP and IFRS leases are recognized as an asset if the
firm bears substantially all the risks and rewards of ownership of
the leased property.
This is classified as a capital lease.
We will return to leases in more detail in the Liability side
of the Balance Sheet.
Deferred Taxes (Category:
Operating)
This item can appear as a non-current asset in a balance sheet.
It arises from net loss carryovers which are classified as
assets when it is determined that there is a greater than 50% chance
of being able to be used in future fiscal periods.
Refer to the discussion in
the Current section for additional information on this category.
Pensions (Category:
Operating)
Pension accounting will be discussed in more detail later in the
Consolidated Stockholders’ Equity topic.
Long-Term Investments
(Category: Investing)
These items represent investments that are expected to be held for
longer terms than one year. These items will include a number of
different measurement bases ranging from fair value to historical
costs. Additional
details are provided in the notes to the financial statements.
Intangible Assets (Category:
Investing)
These items represent nonmonetary assets without physical substance.
To be recognized on the Balance sheet there should be
probable future economic benefits and costs should be reliably
measured. Goodwill is
only recognized in a business combination and research costs
associated with Research and Development (R&D) are expensed for most
industries.
January 1, 2002 the Financial Accounting Standards Board (FASB)
eliminated the “pooling method” of accounting which meant that
goodwill and intangibles are no longer amortized.
Instead under fair value accounting they are placed on the
Balance Sheet but subjected to annual tests for impairment.
Impairment under US GAAP has a technical meaning.
It is the downward revaluation of a fixed asset below its
historical cost and impairment write downs cannot be subsequently
recovered via upward revaluation even if the asset has subsequently
recovered in value.
This is a major current difference between US GAAP and IFRS.
IFRS permits recovery of prior impairments (up to the
original historical cost) if the value has subsequently recovered.
It is noted that neither system allows unrealized gains to be
recognized unlike the earlier cases that involved financial assets.
A Classic Example of Accounting for Goodwill
The worst takeover in US Corporate History was the Time Warner/AOL
merger. At the time of
the merger, even though financial analysts made upbeat comments,
technology had changed and the merger made little sense given that
AOL’s user base relied entirely upon dial up web services.
Further, AOL had
no ability to provide
the new trends of delivery via cable and other high speed delivery
methods because other entities controlled these outlets. However, at
the time of the merger typical reporting was as illustrated below:
That’s AOL folks…
January
10, 2000: 5:26 p.m. ET
Internet leader and entertainment firm to
join forces; new company worth $350B
By Staff Writer Tom Johnson
NEW YORK (CNNfn) - In a stunning
development, America Online Inc. announced plans to acquire Time
Warner Inc. for roughly $182 billion in stock and debt Monday,
creating a digital media powerhouse with the potential to reach
every American in one form or another.
With
dominating positions in the music, publishing, news, entertainment,
cable and Internet industries, the combined company, called AOL Time
Warner, will boast unrivaled assets among other media and online
companies.
The
merger, the largest deal in history, combines the nation’s top
internet service provider with the world’s top media conglomerate.
The deal also validates the Internet’s role as a leader in the new
world economy, while redefining what the next generation of
digital-based leaders will look like.
"Together, they represent an unprecedented
powerhouse,” said Scott Ehrens, a media analyst with Bear Stearns.
"If their mantra is content, this alliance is unbeatable. Now they
have this great platform they can cross-fertilize with content and
redistribute.”
Source:
CNN Money
Two years later the new accounting standards required the impairment
of goodwill which resulted in the largest write-down:
What AOL Time Warner's $54 Billion Loss Means
By Frank Pellegrini Thursday, Apr. 25, 2002
Sticking out of AOL Time Warner's rather
humdrum earnings report Wednesday was a very gaudy number: A
one-time loss of $54 billion. It's the largest spill of red ink,
dollar for dollar, in U.S. corporate history and nearly two-thirds
of the company's current stock-market value. (It's also, as a lot of
news outlets have noted, more than the annual GDP of Ecuador, but
that's hardly relevant here.) All for something called "goodwill
impairment."
Source Time Business
Liabilities
Current Liabilities
This is the set of obligations that will fall due within one year or
one operating cycle. This
provides the other side of the working capital or operating cycle.
The operating cycle is the time to purchase, manufacture or
provide the inventory or service, sell the product or service for
cash or on account.
Some major line items are:
Accounts Payable (Category:
Operating)
These items are short-term obligations arising from credit extended
to a firm’s suppliers.
The length of time extended by suppliers typically represents the
tradeoff between providing incentives for quick payments and
disincentives (penalty interest) for slow payment.
Notes Payable (Category:
Operating and Financing)
These are short term promissory notes issued to suppliers and
financial institutions.
For example, Notes Payable is not a big deal to an Apple who is
sitting on globules of cash.
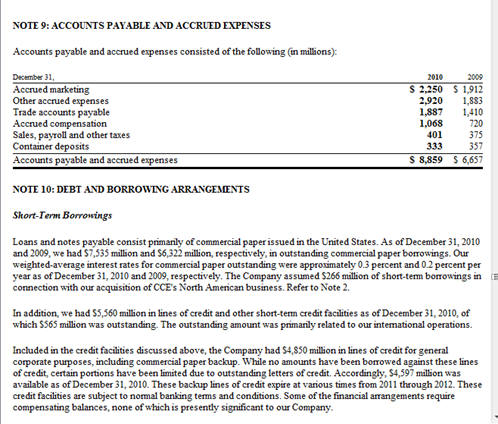
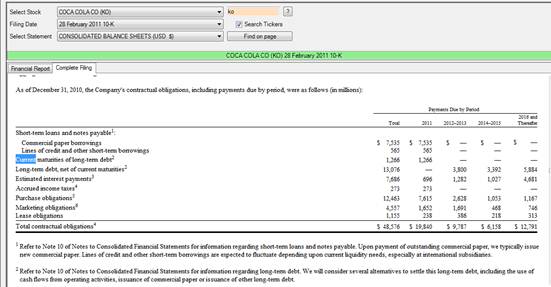
However, notes payable is a big deal to a Coca-Cola who
recently completed acquisitions that resulted from a major strategy
shift.
Example:
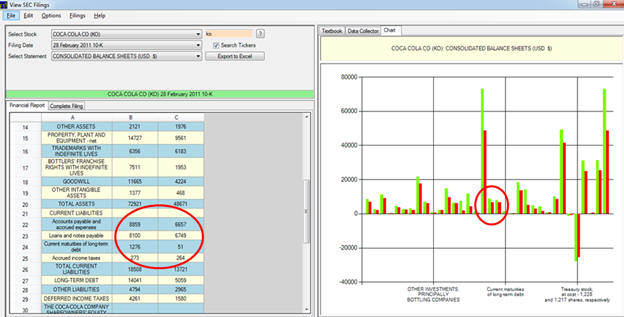
Again as an analyst you must consult the footnotes to the Balance
Sheet to get at the additional detail associated with specific
balance sheet line items:
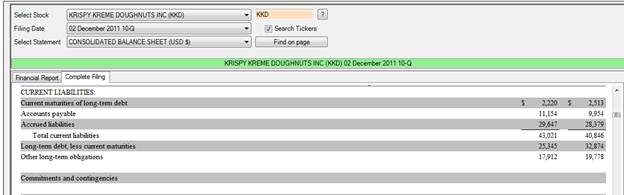
Current Maturities of Long-Term Debt (Category:
Financing)
These items are the long-term debt outstanding that falls due during
the current year. As a
result, it includes the face value of debt that matures during the
current year.
Accrued Liabilities (Category:
Operating)
This item results from accrual accounting.
These items arise from the recognition of expenses prior to
the actual cash being paid.
The credit part of the entry creates an accrued liability.
Unearned Revenue or Deferred Credits (Category:
Operating)
This item results from accrual accounting.
It arises when a firm is paid in advance for services or
product before delivery.
This is one of the most interesting areas of the balance
sheet for an analyst to review.
Why?
First this is a nice liability to have!
It is “unearned revenue” that has an obligation to deliver
services or products.
However, when delivered this becomes Sales Revenue.
Unearned revenue is typical in the technology sector because
a product can be a bundle of goods and services.
From an analyst perspective when forecasting next quarter’s
earnings and revenue large amounts of unearned revenue imply that a
firm may be more likely to meet consensus forecasts because it has
the additional flexibility of being able to convert its unearned
into earned revenue.
For example, a simple to understand “old economy” product such as
produced by Coca Cola result in no unearned revenue.
But for the case of technology stocks such as Apple,
Microsoft and Google unearned revenue may provide powerful signals
to analysts.
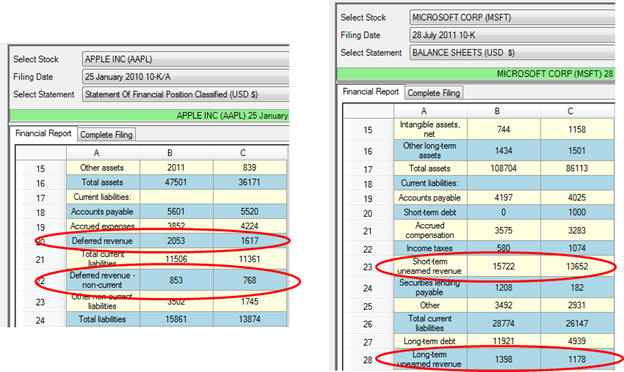
For the case of Microsoft and Apple these very strong deferred
revenue numbers provide each stock with a lot of flexibility for
meeting quarterly revenues.
The efforts required to generate the initial sale have
already been performed and to be recognized as accounting revenue
the remaining services or product must be delivered.
That is, it does not require generating future sales.
For both of these companies their subsequent 10-Q’s resulted in
strong announced results:
Microsoft News Center
News Press Release
Microsoft Reports Record Revenue of $20.9
Billion in Second Quarter
Strong business demand and holiday sales
drive record revenue and EPS.
REDMOND, Wash. — Jan. 19, 2012 — Microsoft
Corp. today announced quarterly revenue of $20.89 billion for the
quarter ended Dec. 31, 2011, a 5% increase from the prior year
period. Operating income, net income, and diluted earnings per share
for the quarter were $7.99 billion, $6.62 billion, and $0.78 per
share, compared with $8.17 billion, $6.63 billion and $0.77 per
share, respectively, in the prior year period. Prior year results
include recognition of $224 million of deferred revenue related to
the Office 2010 technology guarantee program.
Apple Press Information
Apple Reports First Quarter Results
Highest Quarterly Revenue and Earnings Ever
All-Time Record iPhone, iPad and Mac Sales
CUPERTINO, California—January 24, 2012—Apple® today announced
financial results for its fiscal 2012 first quarter which spanned 14
weeks and ended December 31, 2011. The Company posted record
quarterly revenue of $46.33 billion and record quarterly net profit
of $13.06 billion, or $13.87 per diluted share. These results
compare to revenue of $26.74 billion and net quarterly profit of $6
billion, or $6.43 per diluted share, in the year-ago quarter. Gross
margin was 44.7 percent compared to 38.5 percent in the year-ago
quarter. International sales accounted for 58 percent of the
quarter’s revenue.
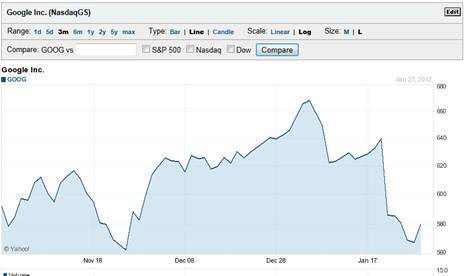
This can be contrasted to Google.
Their quarterly results were not so strong relative to
analyst forecasts:
Bloomberg
Google Quarterly Earnings Miss Hands 99%
Losses to Bullish Options Traders
By
Nikolaj Gammeltoft and Jeff Kearns - Jan 20, 2012 4:32 PM ET
Google Inc. (GOOG) options traders who made
bullish bets before the company’s quarterly report yesterday
suffered the U.S. derivatives market’s biggest losses today after
the search-engine operator missed analysts’ projections.
Google calls posted 10 of the 12 biggest
declines among all contracts traded on U.S. exchanges as of 4 p.m.
New York time, with each tumbling more than 99 percent, according to
data compiled by Bloomberg. Shares of the Mountain View, California-
based company tumbled 8.4 percent, the most since December 2008.
January $595 calls, which expire today, retreated 99.98 percent for
the biggest drop.
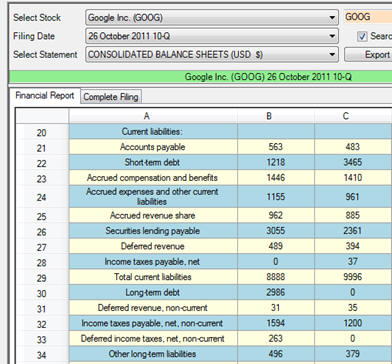
It is interesting to contrast Google’s unearned revenues for the
previous quarter.
Google’s deferred revenues are substantially lower than for an Apple
or a Microsoft and thus Google has less flexibility to meet analyst
expectations:
Missing the sell side analyst forecasts is costly not only to option
traders betting on Google but to the stock in general.
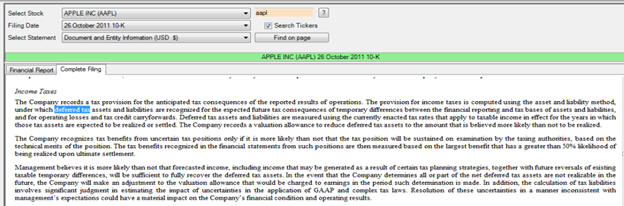
Deferred
Income Taxes (Category:
Operating)
This item results from temporary differences in the recognition of
revenue and expense for taxable income relative to reported income.
The item is governed by FAS 109 and it arises from
differences when calculating taxable and accounting income.
It is noted that no legal obligation exists for deferred
taxes but the items included in deferred taxes are only those items
which are judged to give rise to temporary differences between
taxable and accounting incomes.
Permanent differences are not included in Deferred Taxes.
Long Term Debt (Category:
Financing)
These items are all financial obligations with maturities in excess
of one year. Long term
debt is the residual portion of long term debt that does not fall
due within the next year.
This latter debt is labeled:
Current Maturities of Long-Term Debt
The balance sheet numbers represent aggregate numbers and companies
are required to provide additional financing details in the
footnotes to the consolidated balance sheet (plus other places) as
illustrated for Coca-Cola below:
Capital Lease Obligations (Category:
Financing)
These items arise from the credit entry arising under both US GAAP
and IFRS when leases are recognized as an asset.
That is, if the firm bears substantially all the risks and
rewards of ownership of the leased property this is classified as a
capital lease and both an asset and liability are recorded on the
balance sheet. A lease
liability and lease asset is recognized if any one of four
conditions are met:
•
Lease transfers ownership, contains a “bargain” purchase option,
lease life >= 75% life of asset, lease payments have a PV of 90% or
more of the fair property value
Otherwise it is treated as an operating lease which has no balance
sheet liability implications.
However, US GAAP does require footnote disclosure of leases
and so an analyst can estimate what the Asset and Liability
implications would be if it was treated as a Capital Lease.
This is important if comparing three types of firms.
Firm A owns capacity, Firm B leases the same capacity
structured as an operating lease and Firm C leases the same capacity
structured as a capital lease.
Economically Firms A, B, and C all have the same capacity but
the accounting is very different for Firm B versus A and C.
For the case of B no capacity is recorded on the balance
sheet whereas capacity is recorded for A and B.
As a result, analysts by referring to the footnote
information reassess B’s operating lease as a capital lease to
ensure compatibility if the lease is significant.
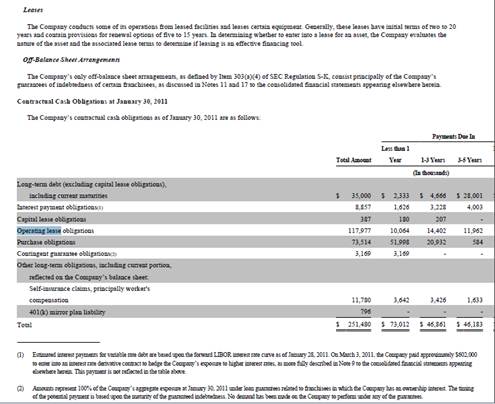
For example, Krispy Kreme current footnote disclosure is as follows
which classifies leases into Capital and Operating:
Postretirement Benefits Other Than Pensions (PRB) (Category:
Operating)
There are two general types of pensions, Defined Benefits and
Defined Contributions.
The latter is common today and has straightforward accounting
implications (Debit Pension Expense and Credit
Cash or Payables).
For the case of defined benefits things are not straightforward.
SFAS 158 (US GAAP) 2006 extended the reporting of defined
benefit plans to communicating the funded status of defined benefit
pension plans as opposed to a detailed pension footnotes.
That is, under SFAS 158,
company “defined benefit” pension plans must recognize the
difference between the projected $ benefit obligation and the fair
value of the plan’s assets as either an asset or a liability.
Old economy companies can have significant defined benefit
obligations. For
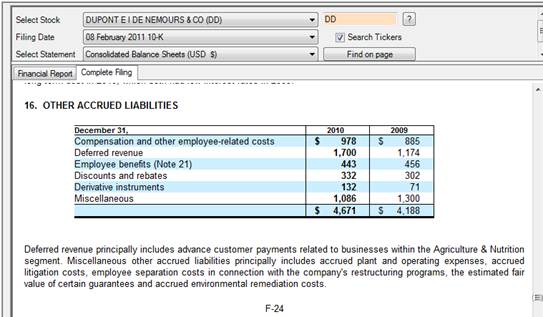
example, DuPont the oldest company in the Dow Jones 30 stocks
reports as follows as “Other Accrued Liabilities:
And further as “Other Liabilities”:
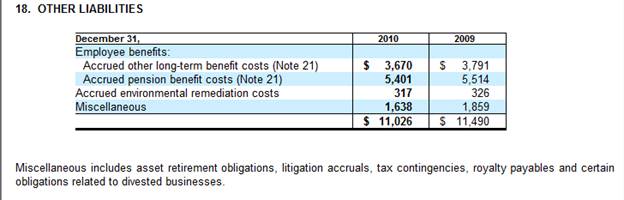
That is, significant defined benefit obligations exist that are
lumped into the above “Other” categories on the Balance Sheet.
It is interesting to observe as a side note that DuPont also
include their Deferred Revenues in Other Accrued Liabilities.
Commitments and Contingencies (Category:
Operating)
This line item can appear on a balance sheet without an amount
beside. It is itemized
to direct a reader’s attention to the disclosures included in the
notes to the financial statements.
Items include non-cancellable leases or other non-cancellable
contracts which are disclosed even if no amount is due at the time
of the Balance Sheet.
For example, consider the following for Krispy Kreme
Commitments and contingencies is listed with a blank beside it.
However, in the footnote information the following additional
information is disclosed:
Note 5 — Commitments and Contingencies
Except as disclosed below, the Company currently is not a party
to any material legal proceedings.
Pending Litigation
On April 7, 2009, a Cayman Islands corporation, K2
Asia Ventures, and its owners filed a lawsuit in Forsyth County,
North Carolina Superior Court against the Company, its
franchisee in the Philippines, and other persons associated with
the franchisee. The suit alleges that the Company and the other
defendants conspired to deprive the plaintiffs of claimed
“exclusive rights” to negotiate franchise and development
agreements with prospective franchisees in the Philippines, and
seeks unspecified damages. The Company believes that these
allegations are false and intends to vigorously defend against
the lawsuit.
Other Legal Matters
Other Commitments and Contingencies
The Company has guaranteed certain loans from third-party
financial institutions on behalf of Equity Method Franchisees
primarily to assist the franchisees in obtaining third-party
financing. The loans are collateralized by certain assets of the
franchisee, generally the Krispy Kreme store and related
equipment. The Company’s contingent liabilities related to these
guarantees totaled approximately $2.7 million at October 30,
2011, and are summarized in Note 8. These guarantees require
payment from the Company in the event of default on payment by
the respective debtor and, if the debtor defaults, the Company
may be required to pay amounts outstanding under the related
agreements in addition to the principal amount guaranteed,
including accrued interest and related fees.
The aggregate recorded liability for these loan guarantees
totaled $1.9 million as of October 30, 2011, which is included
in accrued liabilities in the accompanying consolidated balance
sheet. These liabilities represent the estimated amount of
guarantee payments which the Company believed to be probable.
While there is no current demand on the Company to perform under
any of the guarantees, there can be no assurance that the
Company will not be required to perform and, if circumstances
change from those prevailing at October 30, 2011, additional
guarantee payments or provisions for guarantee payments could be
required with respect to any of the guarantees.
In addition, accrued liabilities at October 30, 2011, includes
approximately $990,000 related to the Company’s assignment of
operating leases on refranchised stores. The Company is
contingently liable to pay the rents on these stores to the
landlords in the event the assignees fail to perform under the
leases they have assumed. During the second quarter of fiscal
2012, the Company recorded a provision of $820,000 for payments
the Company expects to make under a lease guarantee related to a
franchisee whose franchise rights the Company terminated during
the second quarter. During the third quarter of fiscal 2012, the
Company reversed a previously recorded lease guarantee accrual
of $110,000 as a result of the Company receiving a release from
the related guarantee. The aggregate gross guarantee exposure
under all such lease guarantees, without reduction for any
potential sublease rentals or any other mitigation, was
approximately $4.2 million as of October 30, 2011.
One of the Company’s lenders had issued letters of credit on
behalf of the Company totaling $10.2 million at October 30,
2011, all of which secure the Company’s reimbursement
obligations to insurers under the Company’s self-insurance
arrangements.
In addition to entering into forward purchase contracts, the
Company from time to time purchases exchange-traded commodity
futures contracts or options on such contracts for raw materials
which are ingredients of the Company’s products or which are
components of such ingredients, including wheat and soybean oil.
The Company typically assigns the futures contract to a supplier
in connection with entering into a forward purchase contract for
the related ingredient. The Company may also purchase futures,
options on futures or enter into other hedging contracts to
hedge its exposure to rising gasoline prices. See Note 11 for
additional information about these derivatives.
The Company also is engaged in various legal proceedings arising in
the normal course of business. The Company maintains customary
insurance policies against certain kinds of such claims and suits,
including insurance policies for workers’ compensation and personal
injury, some of which provide for relatively large deductible
amounts.
Non-Controlling Interests (Category:
Financing)
This arises when the parent controls less than 100% of the
subsidiary and it gives rise to a line item now described as
“Non-controlling Interest.”
This represents a name change from the traditional label
“Minority Interest” resulting from FAS 160 to emphasize a parent’s
substantive control over a subsidiary rather than a simple ownership
percentage to better reflect the underlying economic and accounting
concepts.
Finally we present a summary of Stockholders’ Equity accounts below
but return to these items in more detail in the section on the
Consolidated Statement of Stockholders’ Equity.”
Stockholders’ Equity
The residual ownership rights in the company are presented in the
this last section of the Balance sheet.
This represents the residual claims against the Assets net of
Liabilities. These
residual owners bear the risks and rewards of from the firm.
Common Stock (Category:
Financing)
The amount listed here is based upon the par or partly paid value of
the shares issued. This
usually bears no relationship to the market value of the stock as it
is based upon the legal par value.
Additional Paid-In Capital (Category:
Financing)
The amount listed here measures the amount by which the original
sales price of the shares exceeded the par amount.
Retained Earnings (Category:
Operating)
This account contains the record of cumulative earnings from the
firm since its inception net of dividends paid.
Accumulated Other Comprehensive Income (Category:
Operating)
This amount comes from the Statement of Stockholders’ Equity.
It largely includes the results from four items:
Unrealized gains and losses in the market value of investments
for-sale securities.
Excess of additional pension liability over unrecognized prior
service cost
Gains and losses from derivatives
Foreign currency translations
Other Equity Accounts (Category:
Financing)
This can contain preferred stockholder claims which are usually paid
a fixed dividend relative to some face or par amount.