
A.2 Appendix: A Quick Tour of the Income Statement
A.2 The Consolidated Income Statement
This financial statement attracts the most attention in the media.
This attention is reinforced by the results from a survey of
managers in the field that found:
�We survey 401 financial executives, and conduct in-depth
interviews with an additional 20, to determine the key factors
that drive decisions related to reported earnings and voluntary
disclosure.
The majority of firms view earnings, especially EPS, as the key
metric for outsiders, even more so than cash flows. Because of
the severe market reaction to missing an earnings target, we
find that firms are willing to sacrifice economic value in order
to meet a short-run earnings target. The preference for smooth
earnings is so strong that 78% of the surveyed executives would
give up economic value in exchange for smooth earnings. We find
that 55% of managers would avoid initiating a very positive NPV
project if it meant falling short of the current quarter's
consensus earnings.�
NATIONAL BUREAU OF ECONOMIC RESEARCH
The Economic Implications of Corporate Financial Reporting
John R. Graham, Campbell R. Harvey, and Shiva Rajgopal
This attention by managers is further reinforced from the results of
a study regarding the incentives faced by CEO�s in the field.
This study concluded:
We find that missing quarterly earnings benchmarks, especially
the analyst consensus earnings forecast, is associated with
career penalties in the form of a reduced bonus, smaller equity
grants, and a greater chance of forced dismissal for both CEOs
and CFOs during the period 1993-2004. These results are obtained
after controlling for the magnitude of the earnings surprise,
operating and stock return performance, and are significant in a
statistical and in an economic sense.
Career penalties for failing to meet the analyst
consensus estimate are higher for firms that give quarterly
earnings guidance and in the post-SOX period. Our evidence
suggests that (i) boards appear to react directly to managers'
ability to meet earnings targets or to the information that is
reflected in meeting such benchmarks; and (ii) senior managers'
preoccupation with meeting earnings benchmarks might be based at
least partly on career concerns.
CEO and CFO Career Penalties to Missing Quarterly Analysts
Forecasts Published: September 24, 2008
Harvard Business School working paper
Authors: Rick Mergenthaler, Shiva Rajgopal, and Suraj Srinivasan
So what is the Consolidated Statement of Income?
Simply it measures the performance of a firm in terms of the income
it generates over a given period of time.
The form of presentation for an income varies across firms
and in particular across industries.
However, in its basic form the following components typically
appear:
Top Line: What revenues
are recognized (e.g., what was sold)?
Less
What did it cost to generate those revenues?
Gross Margin
Less
Period expenses (SG&A, Research and Development)
Income from Operations
Less
tax expenses (period expenses)
Bottom Line: Net Income
Remarks:
The mode of presentation for the income statement varies in
practice. For example,
under US GAAP both single-step and multiple-step income statement
formats are acceptable.
The multiple-step format provides intermediate measures of net
income such as gross profit, operating profit, profit before taxes
and so on. The
single-step format groups categories of revenue and categories of
expenses together, before arriving at the net income number.
In practice statements can be in part single and in part
multiple steps. This is
an important distinction to be aware of when working with the real
world statements because you will usually find it useful to recast a
single step or partial single step statement into a multiple-step
statement for comparison and other purposes.
US GAAP requires some items to be reported separately in the income
statement, such as extraordinary items and discontinued operations.
Extraordinary items are prohibited under IFRS.
Discontinued operations, on the other hand, is highlighted
under both systems for assets held for sale or to be disposed of,
provided that no significant future continuing cash flows will be
generated.
In summary this statement provides the primary source of information
relevant to assessing the profitability of a company.
Understanding the Income Statement with Valuation Tutor
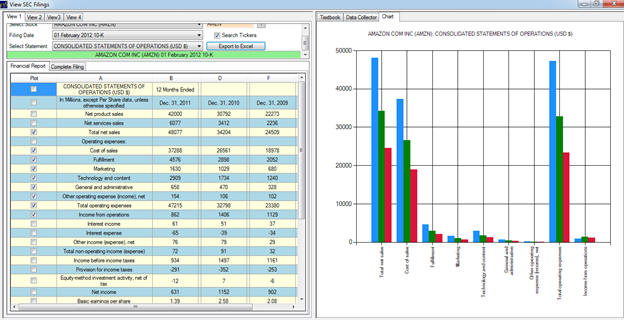
By selecting the Consolidated Statement of Operations for Amazon
from the 2011 10-K reveals the following:
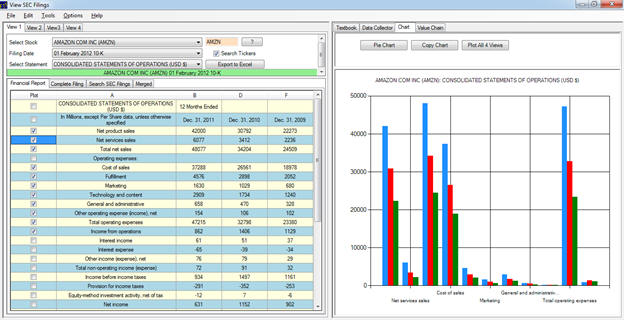
First, observe that Amazon reports in a partial single step income
statement format. The
gross margin for example is not reported even though the cost of
sales is provided. As a
result, an analyst would likely immediately recast Amazon�s
statement into the following generic format:
Net Sales
Less Cost of Sales
Gross Profit
Less Selling and General Administration Expenses
Less Other Expenses
Net Income Before Interest and Taxes (Equivalently EBIT)
Interest Expense
Net Income Before Taxes (Equivalently EBT)
Tax Expense
Net Income After Taxes
You can observe that Amazon already classifies on the basis of
Income from Operations (EBIT (Earnings Before Interest and Taxes))
and then Income Before Taxes (EBT) and finally Net Income (NI).
The Consolidated Income Statement represents a flow concept in the
sense of providing important insights into how a company has
performed between two points in time. The 10-K for additional
comparison purposes requires three years of income statements are
presented for comparison purposes.
Elements of the Income Statement
Net Sales
This contains the aggregate of sales revenue given the revenue
recognition criteria which is usually discussed in the critical
accounting judgments section of the 10-K.
The net part refers to sales revenue net of an allowance for
bad and doubtful debts.
Sales Revenue is a difficult area in general for accounting.
The major difficulty is in applying revenue recognition
criteria.
That is, when does revenue become earned?
Loosely the answer to this question is when goods are transferred or
services rendered irrespective of cash payments under accrual
accounting. Formally,
there are two models for revenue recognition, the Merchant Model and
the Agent Model. These
models will directly impact the format of income statement reporting
in relation to whether cost of goods sold is formally recognized or
not. In practice it is
not uncommon for a firm today to measure some sales revenue under
both models and an alert analyst will read the 10-K closes to
identify what combination of models is actually being used.
We describe these models briefly next.
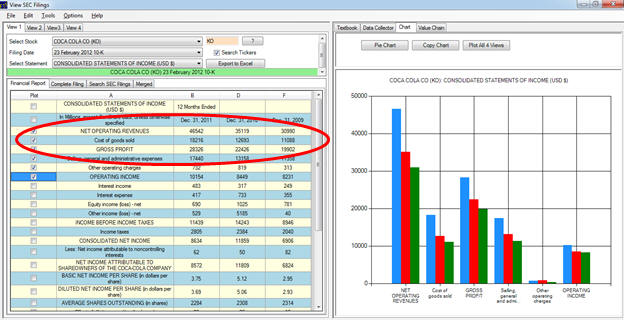
Merchant Model:
Under this model the merchant bears all of the risk of the
inventory and therefore books the selling price as revenue when sold
(Gross Revenue Recognition) and the cost of the inventory as
COGS. This is often
referred to as the �gross revenue reporting method� because COGS is
itemized separately.
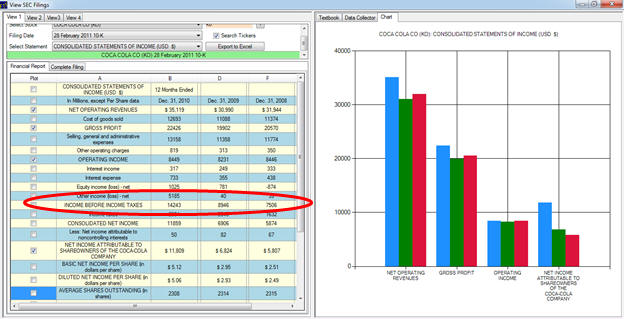
For example, Coca-Cola uses this model in its 10-K and itemizes
Gross Profit as follows:

Agent Model:
an agent provides a service to a customer (facilitating the purchase
of a ticker but not providing the actual product/service) and under
this model the agent is permitted to book the agent�s fee or
brokerage fee as revenue (Net Revenue Recognition).
Under this method there is no COGS.
An example of the Agent Model is provided by Live Nation
Entertainment:
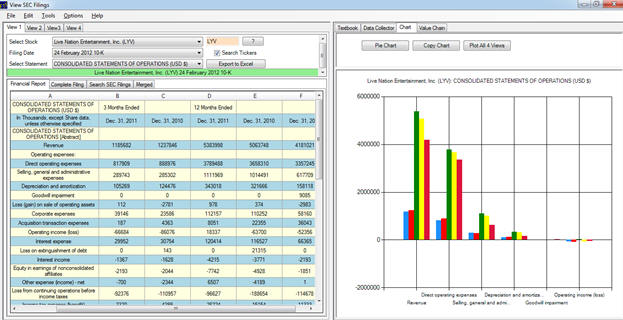
Observe there is no Cost of Goods Sold when selling tickets for
entertainment.
Cost of Revenue (Cost of Goods Sold) Summary
These items include the costs associated with selling or providing
the goods and services that generate the net revenue.
Cost of Revenue largely consists of direct or variable costs
associated with generating sales.
Cost of Revenues is defined relative to the firm�s business model.
For example, consider a traditional example of cost of goods
sold, Walmart versus a new economy example of cost of sales, Google.
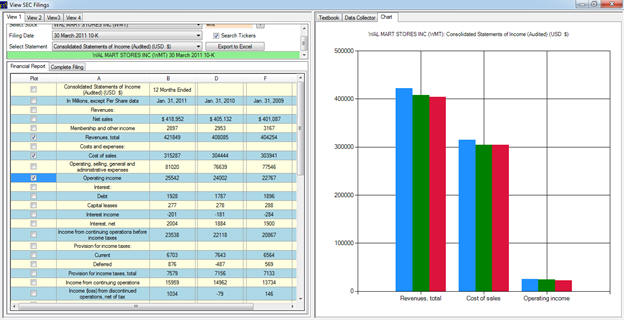
Cost of Sales Walmart
Walmart buys and sells inventory.
Cost of sales includes actual product cost, the cost of
transportation to the company�s warehouses, stores and clubs from
suppliers, the cost of transportation from the company�s warehouses
to the stores and clubs and the cost of warehousing for our Sam�s
Club segment.
Cost of Revenues Google
Google�s revenues consist primarily of traffic acquisition costs.
Cost of revenues are traffic acquisition costs.
These consist of amounts ultimately paid to our Google
Network members under AdSense arrangements, certain other partners
(our distribution partners) who distribute our toolbar and other
products (collectively referred to as access points), and otherwise
direct search queries to our website (collectively referred to as
distribution arrangements). These amounts are primarily based on the
revenue share and fixed fee arrangements with our Google Network
Members and distribution partners.
Gross Profit (a component of a multiple-step income statement)
This measures the difference between net revenues and the cost of
sales. If Gross Profit
is reported it is calculated prior to accounting for operating
expenses such as selling and administration.
Under segment reporting this is provided by functional lines
of business.
Sales less Cost of Sales determines the Gross Profit or Gross Margin
A Non US GAAP Popular Variation
A further adjustment made by most analysts in a multiple-step income
statement is to measure EBIT (Earnings Before Interest and Taxes) to
keep the investment and financing decisions for the firm whereas US
GAAP treats interest expense as part of operations.
The impact from the investment and financing decision is
separated as follows:
Gross Margin
Less Operating Expenses (not including any financing expenses)
EBIT (Earnings Before Interest and Taxes)
Less Financing expenses
EBT (Earnings Before Taxes)
We next summarize the above structure.
Operating Expense and EBIT
Accrual Accounting Income applies the matching expenses to revenue
test to identify operating expenses.
The matching principle imposes a hierarchical test as
follows:
�
Test 1: Match expenses
to revenue (product expense)
�
Test 2: Match expenses
to the period (period expenses)
That is, if the expense cannot be related to the revenue recognized
then it is matched to the period of time that the revenue is
recognized in under this principle.
Most operating expenses are period expenses although some
such as selling can be product expenses.
Today, fair value accounting further extends the matching
principle to impairments of operating assets (current (e.g.,
inventory) and non-current (Property Plant and Equipment, Capital
Leases, Intangibles).
This generates additional sources of operating expenses because an
impairment is an unrealized loss.
Formally, SFAS 144 defines an impairment loss to be recognized if
the carrying amount of a long-lived asset is not recoverable (e.g.,
via a sale) and exceeds its fair value.
That is, the fair value of the asset is below the existing
book value so that impairment results in writing down the asset to
its fair value on the books.
In turn another important standard, SFAS 157 formally defines fair
value as the �price that would be received to sell an asset or paid
to transfer a liability in an orderly transaction between market
participants at the measurement date.�
That is, the transaction cannot be within a consolidated
group but instead be what is often referred to as an �arms-length�
transaction.
Some specific items in operating expenses are listed below.
These include selling, administration and related expenses.
Related expenses are the indirect costs associated with
generating revenue such as depreciation and amortizations and lease
expenses.
Selling, General and Administration Expenses (largely period
expense)
Depreciation and amortization
(period expense)
-
Includes capital lease adjustments (today is subject to an
impairment test)
-
Amortization of intangibles is based on impairment tests
Research and Development Expenses (period expense)
Lease Expenses (period expense)
Repairs and Maintenance (period expense)
Combined in a multi-step format this results in operating profit or
EBIT (Earnings Before Interest and Taxes) as it is often referred
to.
Operating Profit (EBIT)
This item measures the profit from the company�s operations.
It reflects how well the company is implementing its
investment decision ignoring how it has financed its assets.
Some Practical Notes
In practice there are large differences in the external reporting of
operating expenses. For
example, consider three well-known companies:
Wal-Mart, Apple and Amazon.
For the case of Wal-Mart operating expenses is a single line item:
And for the case of Apple two line items as follows:
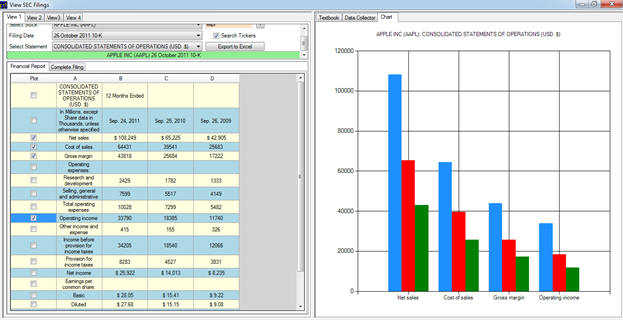
This is because Research and Development is a more significant item
for Apple relative to Wal-Mart.
Amazon on the other hand provides the most detailed reporting
of this category by providing five sub-categories as follows:
For technology firms operating expense categories provide useful
information and in particular in relation to their Research and
Development Expenditure is US GAAP requires expensing (with the
exception of software).
To put this into perspective it is informative to compare the
average R&D per employee for some technology firms:
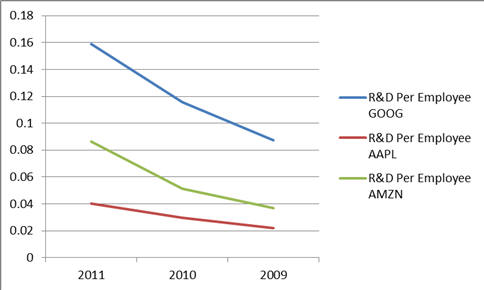
That is, Amazon spends more than Apple but both are less than Google
on a per employee basis.
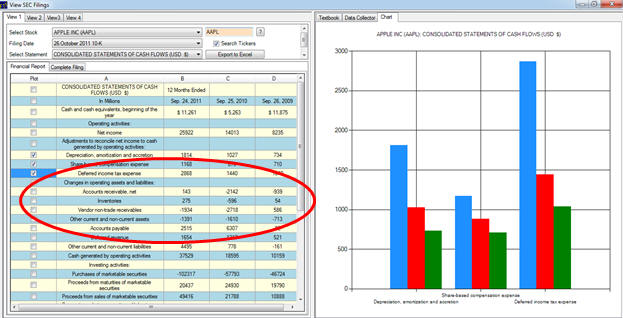
Another practical note is that depreciation expense can be included
in both cost of revenues as a product cost and operating expenses.
However, it is always disclosed separately in the
consolidated statement of cash flows.
As a result, you may always find a finer breakdown of
operating expenses in the cash flow statement than the actual income
statement which provides more aggregated disclosures.
For example, for the case of Apple additional details are provided:
Other Income or Expenses
This item includes revenues and expenses from other sources that are
not the firm�s operations.
This can include dividends or interest expenses associated
with other investments.
This can also include items arising when the company accounts for
its investments using the equity method.
These items can sometimes be very large.
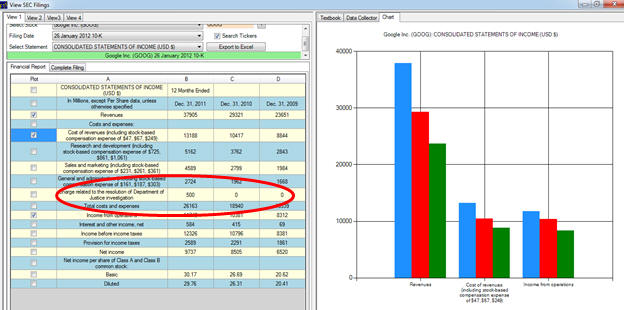
For example, consider the case of Google.
In 2011 they were the subject of a Justice Department probe
and it was conjectured that they may have to pay $500 million in
fines.
Google May Pay $500 Million After Ad Probe By The Justice
Department
By MICHAEL LIEDTKE 05/11/11 07:58 AM ET Associated Press
SAN FRANCISCO -- Google Inc.'s lucrative online advertising
system is facing a U.S. Justice Department investigation that is
expected to cost the Internet search leader at least $500
million.
The disclosure made by Google on Tuesday in a quarterly report
to the Securities and Exchange Commission serves as the latest
reminder of the intensifying regulatory scrutiny facing the
Internet's most powerful company.
It turned out that the $500 million was correct and in their 2012
10-K Google accounted for this transparently as follows:
Finally, Fair Value Accounting is having an increasing influence upon the income statement. In particular, SFAS 159 (actually now ASC 825-10) gives entities the option to account for some assets at fair value that otherwise would be accounted for under the equity method (for the case of a 20-50% ownership). This was the case for intangibles with Coca-Cola�s acquisition of bottling plants. By electing this fair value option Coca-Cola accounted for the gain from their purchase as follows:
Earnings Before Taxes (EBT)
This measures the earnings before income tax expenses are accounted
for. It is relevant to
analysts to assess what the company’s effective tax rate is.
This ratio is calculated by dividing income tax expense by
the earnings before taxes.
Effective tax rates can vary significantly from corporate tax
rates for a variety of reasons including the result of operations in
foreign countries. Many
corporations will provide additional details in relation to taxes
paid in their footnotes to the accounts.
Special Items
Under US GAAP extraordinary items are permitted and are disclosed as
a separate category.
The common special items are:
Extraordinary Items (US GAAP not IFRS)
These are unusual items plus items that are not expected to re-occur
including one time adjustments from accounting changes.
A major difference between US GAAP and the International
Financial Reporting Standards (IFRS) is that the latter does not
separately itemize extraordinary items.
Discontinued Operations
Other (accounting standard changes and other items)
Net Earnings or Net Income or Net Profit
This is referred to as the “bottom line” which is the major focal
point of an income statement.
Additional Categories
There is a variety of additional information provided in an income
statement. First, is
the major ratio EPS (earnings per share).
Earnings Per Share
This is the net income available to the weighted average number of
common shares outstanding over the year. US GAAP requires that if a
company has a complex financial structure that includes embedded
derivatives such as convertible securities then the earnings per
share needs to be expressed in two forms.
EPS Basic versus Diluted
Basic uses the common stock outstanding whereas Diluted assumes that
convertible securities are exercised so that the number of issued
shares would increase.
Additional line items provided by companies filing under US GAAP
provide this EPS information broken up into Continuing and
Discontinuing operations.