
7.23 IBM Example: Sensitivity Analysis
By
how much do we need change the value of key inputs to make IBM’s
assessed value more consistent with the market price?
This will provide important insights into whether we assess the
current market price to be reasonable or not.
By answering the above question provides rich insight
into how IBM is being valued by the market as well as which
inputs of our “first pass” analysis may be optimistic.
Given there are three main inputs into the model then
sensitivity analysis should focus on the three major inputs –
growth behavior, free cash flows and the cost of equity capital.
At the end of the last section it was inferred that IBM’s
value could be assessed independently of current growth behavior
assumptions. As a
result, the main sensitivity analysis will focus on our
assessment of FCFE.
However, first we will reduce growth assessments.
Impact of Stage 1 Growth
We will work with the latter first.
Suppose we predicted zero abnormal growth in excess of
normal growth for IBM over stage 1.
That is, assume that the FCFE grows at the normal rate,
0.045, in perpetuity.
This is not realistic for IBM but it will serve as a
benchmark. That is,
we are assuming a growth rate equal to the economy wide growth
rate for both stages.
So in summary current parameters appear as follows:
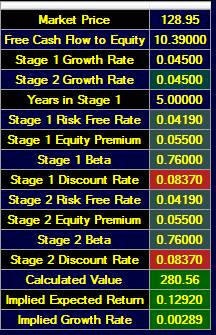
This reduces IBM further to $280.56.
Second in our sensitivity analysis, we can consider our FCFE
estimate.
Current sales revenue projections for IBM from Yahoo are:
Revenue Growth Forecast = 4.40% for 2010 and 4.10% for 2011.
In the earlier chapter on Accounting Ratios and Firm Decisions
the concept of Degree of Operating Leverage was introduced.
This number provides an indication of by how much
Operating Earnings will grow by.
Using the default FTS data for IBM the degree of
Operating Leverage for IBM is:
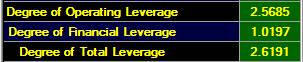
That is, if sales increase by 4% then Operating Income is
predicted to increase by 2.56*0.04 = 0.1024 assuming fixed costs
remain fixed. Thus,
the abnormal growth estimate for IBM appears to be reasonable
for FCFE.
Sensitivity
Analysis on FCFE Estimates
We can now ask the question whether we have greatly
overestimated the FCFE?
We next more closely examine the CAPEX assumptions (Source 10K
Cash Flow Statement 2009, 2008 and 2007):
In IBM’s 10-K estimate they work with $3.7billion as CAPEX (see
earlier). One quick
test for assessing the adequacy of CAPEX is to compare it to
Depreciation Expense.
In the normal growth phase we would expect CAPEX to be
approximately equal to Depreciation expense.
In the Stage 1 growth phase we would expect it to be
higher. As a
result, the IBM estimate for CAPEX is likely to be on the low
side.

From the above disclosures IBM’s CAPEX is around Depreciation
for 2009 (3.7 billion versus $3.773 billion).
Remark:
(Significant Other Investing Cash Flow Items):
Observe that Acquisition of businesses, net of cash acquired has
a re-occurring net outflow component.

In other words this pattern of re-occurrence can be
interpreted as additional CAPEX.
As a result, we will next adjust CAPEX by the 3-year
average of these outflows/inflows = (400 – 1194) + (71 –
6313) +(310 -1009) = 2,578.33.
Adjusted CAPEX = 6.519 + 2.578 = 9.097 billion
Adjusted FCFF = 18.9 – 9.097 = 9.803 billion
Recall, from the earlier calculation of FCFE above the Debt
Ratio = 0.239, and
FCFE = FCFF + Debt Ratio*Adjusted CAPEX = 9.903 +9.097*0.239
= 11.977 billion
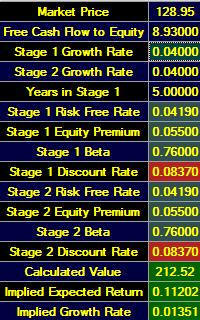
FCFE per share = 11.977/1.341 = $8.93
As a result, by still working with a complete set of
conservative numbers for IBM the intrinsic value assessment
is still $275.
As a result, we are left to conclude that the expected return
from IBM stock is currently higher than what the cost of equity
capital would suggest.
In particular, the implied Expected Return is 11.202%:
Implications for Investors
In the analyses in this chapter, the assessments of IBM’s
intrinsic value were all significantly higher than current
market prices. So
the question arises: if the intrinsic value is greater, does
this have any trading implications?
The answer to this question lies in the Implied Expected Return
number provided in Valuation Tutor’s calculator.
This is the expected return implied by IBM’s stock price.
Technically, it is the
expected return at which the current stock price equals the
intrinsic value. In
the above screen this is 0.11202 and this provides a forecast of
IBM’s price in one year.
Projected Stock Price for IBM in 12-months:
$128.95*1.149 = $148.16
Important
Disclaimer:
The above projections are computed from the assessed
expected returns resulting from a textbook analysis of IBM’s
intrinsic value.
That is, the purpose of this exercise is designed for classroom
teaching/learning purposes.
Actual realized returns can vary substantially from what
is calculated in this way!