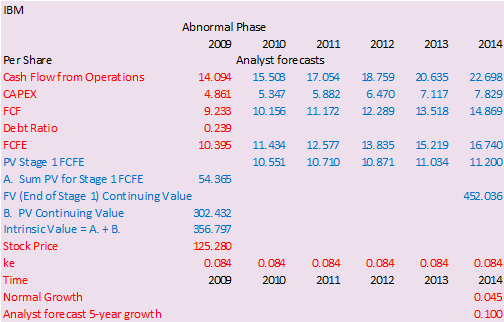
7.22 Verifying the Calculations for Intrinsic Value

In the above grid the red numbers are the
estimated inputs, expressed on a per share basis, into the
2-Stage FCFE valuation model.
That is, FCFE 10.395 which was computed from cash flow
from operations, adjusted CAPEX and the estimated debt ratio as
described earlier.
The stage 1growth was 0.10, normal growth 0.045 and cost
of equity capital 0.084.
The two stage growth model computes the intrinsic value
as the PV of future economic dividends (i.e., FCFE) that the
stock is assessed to generate.
Stage 1 covers 2010, 2011, … , 2014.
The FCFE for 2010 is 10.395*1.10, 2011 = 10.395*1.10^2
and so on.
Alternatively this can be computed from the projected growth in
cash flows from operations, projected CAPEX, and the assessed
debt ratio. Thus for
2010 11.434 = 15.503 – 5.347 + 0.239*5.347 (FCFE = FCFF + Debt
Ratio*CAPEX). The
projected 2010 cash flow from operations is 14.094*1.10 = 15.503
and similarly for CAPEX.
Present Value of FCFE Stage 1
The PV FCFE for Stage 1 equals the sum of
FCFE2010/(1.0837)+ FCFE2010/(1.0837^2) +
FCFE2010/(1.0837^3) + FCFE2010/(1.0837^4)
+ FCFE2010/(1.0837^5 ) = $54.36
Present Value of FCFE Stage 2 (Going Concern)
IBM is presumed to be a going concern in
this exercise. As a
result, at the end of the Stage 1 IBM’s FCFE is assumed to grow
in perpetuity at the constant normal growth rate (0.045).
As a result, at the end of 2014 IBM’s stock price is
assumed to be computed from Gordon’s constant growth model.
Terminal Price2014
= 16.740*1.045/(0.0837 – 0.045) = 452
PV Continuing Value =
452.036/(1.0837^5) = $302
Important Note:
The majority of the intrinsic value of a stock comes from
the PV of continuing value.
In other words events impacting the stock beyond the
stage 1 growth phase of the stock and which is well beyond any
reasonable estimate for a recession to last.
The actual stock market would appear to be much more
myopically focused such that the events from the labor figures
released to the market Friday June 4, 2010 for the month of May
triggered a large market response.
Intrinsic Value for IBM
Intrinsic Value = PV FCFE Stage 1
+ PV Continuing Value (Stage 2) = 54 + 302 = $356
As an immediate comment this spot price
prediction is well above the current market value for IBM.
From the above analysis one could question whether the
projection of $452 is realistic for the end of 2014!
In other words the normal growth assumption in perpetuity
of 0.045 appears to be much higher than what is implied in the
market for IBM now.
As a result, in sensitivity analysis we will reduce normal
growth as one of the variables to assess the impact of this on
IBM’s assessed intrinsic value.
Consider the following re-arrangement of
IBM’s assessed intrinsic value:

In the above arrangement we have broken
up intrinsic value into three major components:
PV of FCFE2010 in
perpetuity assuming zero growth = $136.606
PV FCFE Stage 1 in Excess of FCFE2010
= $9.155
PV Continuing Value beyond Stage 1
in Excess of the zero growth FCFE perpetuity = $211.036
The sum of the above two PV’s =
$356.797
What this illustrates that if the
assessed FCFE is correct and the cost of equity capital is
reasonable then IBM is being currently priced below is zero
growth perpetuity value.
