
8.16 Understanding the Numbers
The
following screen provides a breakdown of the valuation model
into its pieces.
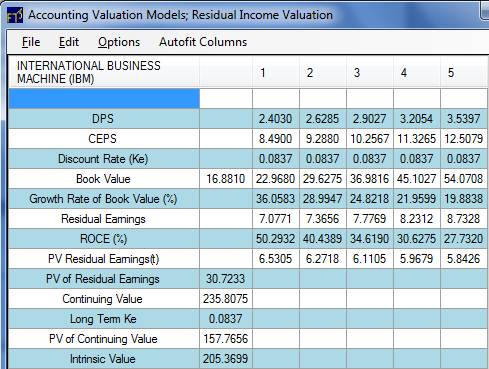
First in this current example time 0 = 2009 and we define the
intrinsic value of IBM as the PV of future residual earnings.
The time line for the IBM example is:
1 = 2010, 2 = 2011, 3 = 2012, 4 = 2013, 5 = 2014.
In the following screen the calculations are broken down into
their spreadsheet form. You
can verify the numbers (within rounding) using Excel.
Interpretation of
the rows above:
DPS = Dividend per Share.
For 2010 2.4030 = 8.49 * 0.283 = 2010 projected residual
earnings times the dividend payout ratio
CEPS = Comprehensive Income per share for each year, 2010, 2011,
2012 ….. In the
above screen the CEPS for 2009 = 7.543.
Recall the assumed growth behavior was as follows:
Year 1: 2010 =
7.543*1.1255
Year 2: 2011 =
8.49 * 1.094
Year 3: 2012 =
9.288 * 1.1043
Note:
The above convention is consistent with typical textbook
presentations where the 5-year growth forecast is applied over
years 3-5. However,
a variation that you can use is to compute the implied growth
forecasts for years 3-5 from the 1-year, 2-year and 5-year
forecasts. This is
computed as follows:
Computing Implied forecast for years 3-5:
Recall for 2010 IBM’s growth was forecast to be 0.125, for 2011
this is 0.094 and for the next 5-years 0.1043.
As a result, the annual growth forecasts for 2012, 2013,
2014 is implied from the above three numbers.
That is, 1.125*1.094*x*x*x = 1.1043.
Solving for x yields x= 0.1007.
If you prefer to use this internally consistent number then
change the Stage 1 growth phase number to 0.1007 (for Stage 1
growth because the stage 1 growth is applied to years 3-5 in
this model only because you have direct estimates for CEPS1 and
CEPS2 i.e., years 1 and 2).
If you did this, the calculation details would appear as:
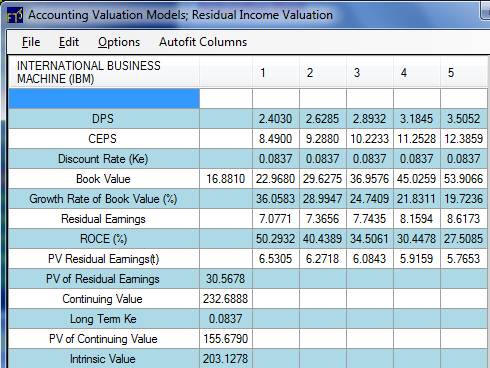
This is a refinement that uses an internally consistent set of
Growth Forecasts.
This can be contrasted with the initial set of numbers (see
below which reveals intrinsic value initial estimate = $205
versus $203). Such
a refinement makes a small difference to the projected intrinsic
value, which may explain why many ignore this and just work
directly with the 5-year growth forecast left.
So we will work with the original abnormal growth number:
