8.12 Application IBM Step 3: Estimating Growth in Book Values
To project residual earnings over time we further need to assess the
growth behavior of the book value per share.
This requires combining information about earnings growth
rates as well as dividend policy as described next.
When we enter period t, the book value is BVt-1.
In period t, comprehensive income CIt is
generated, and if the firm pays dividends, dt is paid out
in dividends. If no new
shares are issued, then the book value at the end of period t is
BVt = CIt
+ BVt-1
- dt
IBM Example:
Projecting residual income over time requires that we account for
the evolution of dividends and changes in book value over time.
This requires assessing dividend policy relative to
Comprehensive Income as opposed to regular accounting income.
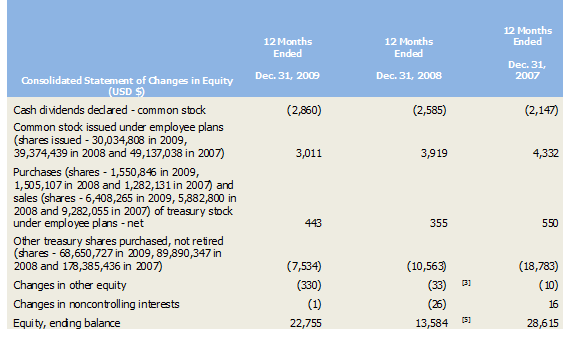
Dividend Information is available from the Consolidated Statement of
Changes in Equity (see chapter 1) which was exported into Excel from
the SEC in chapter 1:


Continuing the example using the 10-K filings then the dividend per
share for IBM equals:
Dividend per Share =
Dividends/Shares outstanding
=
2,860/1,341 =
$2.132 equals the dividend per share.
Dividend Payout Ratio (Relative to Comprehensive Earnings) =
2860/10115 = 0.283
Comprehensive Earnings per share =
$10,115/1341 = $7.543
Dividend forecast information from analysts is available on the web.
For example, in Valuation Tutor click on Profile to access
analyst forecasts for dividends for IBM:

The forward annual dividend is predicted to be $2.60 per share.
Dividend Summary
Dividend per Share =
Dividends/Shares Outstanding = 2,860/1341 = $2.132 equals the
dividend per share.
Growth Forecasts
What is the consensus 5-year growth forecast for IBM?
Here as a first pass you can check consensus analyst forecasts from
a couple of sources on the Web.
To check consensus forecasts click on Analysts in Valuation
Tutor.

These numbers are constantly revised over time in response to
changes in the economy.
At the time of this example these were:
Current Year (FY2010):
12.6% Yahoo Finance and
12.5% MSN Investor
FY 2011: 9.2% Yahoo
Finance and 9.6% MSN Investor
5-year projection:
10.86% Yahoo Finance and 10.00% MSN Investor
Source:
We will use the average of these estimates: FY2010:
12.55%, FY2011:
9.4% and for 5-Years:
10.43% respectively as a first pass.
In a two stage growth model growth behavior is accurately forecast
out for some period of time which is usually 5-years.
Then a simplifying assumption is made that the income grows
in perpetuity at some constant rate.
This constant rate is referred to as the normal growth rate.
The normal growth rate is constrained by economy wide growth
as we cannot assume that a stock grows in perpetuity at a greater
rate than this constraint.
Otherwise, the stock (in the distant future) is implied to
grow larger than the economy as a whole – a contradiction.
