
6.7 Example: Historical Growth Rate of IBM’s Dividends
If a stock pays dividends over a long period of time then we estimate the constant growth directly from the dividend series. This is the case for IBM where we analyze approximately 50-years of quarterly dividends. To estimate dividend growth we obtained quarterly dividend data for IBM from January 1962 through to February 2011 from Yahoo Finance:
Step 1: Got to Yahoo Finance and enter the stock ticker IBM
Step 2: Click on Historical Prices and select Dividends only:
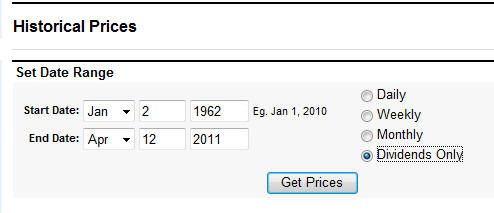
Step 3: Click on
Get prices above and then click on Yahoo’s button download to a
spreadsheet. Save the .csv
file and then open in Excel:
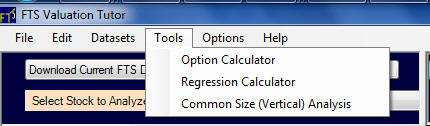
Step 4: Give focus
to Valuation tutor and select the Regression Calculator in Valuation
tutor from the Tools menu item:
Step 5: Set the
Regression calculator as follows:
By ticking the Take Log of the Dependent Variable will let the calculator compute the growth coefficient directly:
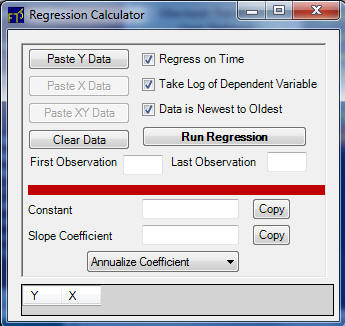
Step 6: Now copy
the dividends from Excel’s cells B2 down (see earlier step 3 above
for the Excel sheet) and paste into Valuation Tutor by clicking on
"Paste Y Data" above and then click on Run Regression:
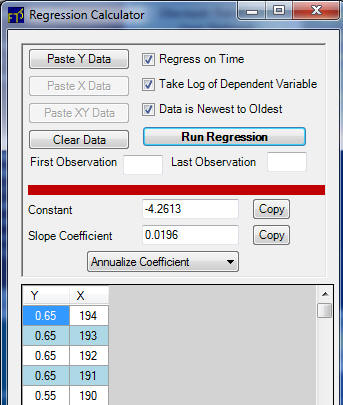
The coefficient for time (quarters) is 0.01953 which from this regression provides a direct estimate of constant growth for a quarter. We can annualize this estimate as follows: 1.0196^4 = 1.08 for 8%. That is, over a very long period of time dividends from IBM have grown at an annual rate of 8% per annum.
You are encouraged to repeat the
above example for a traditional or old economy stock of your choice
that has a long series of dividends available.