6.15 Questions
Question 1:
Define and describe what is meant by the intrinsic value of a
stock.
Question 2:
What is the relationship between the intrinsic value of a
stock and the price of a stock in a “efficient market?”
Question 3:
What important assumptions are made when apply a constant
dividend growth model to assess the value of a company’s stock?
Question 4:
What is the cost of equity capital?
Information for Questions 5-17
Abstract:
The average equity premium, or Market Risk Premium (MRP)
used by analysts in the USA (5.1%) was similar to the one used
by their colleagues in Europe (5.0%). But the average MRP used
by companies in the USA (5.3%) was smaller than the one used by
companies in Europe (5.7%), and UK (5.6%).
Source:
Market Risk Premium Used in 2010 by Analysts and Companies: A
Survey with 2,400 Answer,s by Pablo Fernandez and Javier Del
Campo Baonza.
Question 5:
In the CAPM, describe the equity premium and using the data
provided, what is a reasonable estimate for the equity premium?
Question 6:
In the summary abstract provided the MRP is given from the
analysts’ (i.e., investors’) perspective and a company’s
perspective. What would
be the two interpretations of the cost of equity capital when viewed
from investors’ and companies perspectives?
Question 7:
In the summary abstract provided the MRP is given from the
analysts’ (i.e., investors’) perspective and a company’s
perspective. Referring
to your answer to the previous question, would CAPM predict that the
cost of equity capital when viewed from investors’ and companies
perspectives is the same or different?
(Provide brief support for your answer – why or why not).
Question 8:
In the summary abstract provided the MRP is given from the
analysts’ (i.e., investors’) perspective and a company’s
perspective. Referring
to your answer to the previous question from this survey on average
would the estimate for the cost of equity capital under CAPM be the
same if predicted by analysts versus if assessed by companies?
(Provide brief support for your answer – why or why not).
Question 9:
How would you estimate the cost of equity capital using CAPM
for Duke Energy Corporation (DUK)?
Provide brief reasons to support your choice of inputs.
Question 10:
In the MCPM approach to estimating the cost of equity
capital, it is argued that the cost of equity should be higher than
the cost of debt capital; the difference is called the “excess
equity return.”
Describe in words the reasoning underlying this argument.
Question 11:
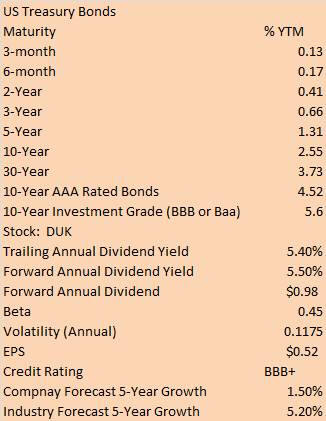
Referring only to the data provided, if DUK raised cash by
issuing a corporate bond what would the approximate Yield to
Maturity expected to be?
Provide reasons in support of how you arrived at this number.
Question 12:
The MCPM approach uses the value of a put option to estimate
the “excess equity return.”
This is because a put option can be used to insure that the
return from a stock is no less than the return from a corporate bond
issued by the same company.
Describe briefly why a put option can be used to insure a
stock’s return over time.
Question 13:
Using the data provided, what would the inputs be into
Valuation Tutor to calculate the cost of equity capital using the
MCPM approach?
Question 14:
Describe how the constant
dividend growth model assesses the intrinsic value of a stock.
Question 15:
Provide the mathematical description of the constant dividend
growth model.
Question 16:
Refer to your answer to the previous question.
What would your estimate for constant growth be for the Duke
Energy Corporation (DUK) if you use CAPM to estimate the cost of
equity capital? Note:
if you have already estimated the cost of equity capital for DUK use
this estimate otherwise first estimate the cost of equity capital
for DUK using the data provided.
Question 17:
Suppose
the MCPM estimate for the cost of equity capital for DUK is 7%.
Estimate the constant dividend growth using the constant dividend
growth model and MCPM.
Question 18:
Suppose
the MCPM estimate for cost of equity capital for DUK is 7%.
By applying the
constant dividend growth model to DUK what is the implied
constant growth rate given:
a.
Your CAPM estimate for ke
b.
The assumed MCPM estimate for ke (= 7%)
Discuss briefly
the reasonableness of each implied growth rate and which do you
suggest is more realistic?
Question 19:
Suppose you have current
dividends per share (d0) and the constant growth gConst
in dividends. Write out
the constant growth model for intrinsic value of a stock using
current dividends at time t=0 (i.e., d0 and gConst
) and describe this form of the constant growth model in
words.
Question 20:
Referring to the previous question, observe that current
dividends can be expressed as Earnings per Share (EPS) times the
dividend payout ratio (PR).
Re-express the constant growth model in a form that works
with EPS.
Question 21:
In the previous question you expressed the intrinsic value of
a stock in terms of EPS and the dividend payout ratio (PR).
Suppose the current stock price, P, equals its intrinsic
value. From price
ratios you learned that the Price/EPS, referred to as the P/E ratio,
is arguably the most popular price ratios.
Re-express the P/E ratio in terms of its predicted intrinsic
value by dividing the EPS version of the constant dividend growth
model by EPS. Describe
in words what the predicted drivers of the P/E ratio are when
performing the steps that relate P/E ratios to the constant dividend
growth model.
Question 22:
In the two stage growth model of intrinsic value, describe in
your own words how this model differs from the constant dividend
growth model?
Question 23:
Suppose you estimate the two growth inputs to a two stage
dividend growth model (abnormal growth and normal growth) and you
estimate constant growth for a constant dividend growth.
Which of the following is most correct? Provide brief reasons
in support of your answer.
i.
Constant growth is always less than normal growth
ii.
Constant growth is always higher than the abnormal growth estimate
iii.
Constant growth lies in between normal and abnormal growth
Question 24:
Can abnormal growth in a two stage growth model of intrinsic
value ever exceed the overall growth rate for the economy as a
whole? Provide reasons in support for why or why not.
Question 25:
Can the normal growth rate in a two stage growth model of
intrinsic value exceed the forecast growth rate for the economy as a
whole? Why or why not.
Question 26:
Suppose you are applying the two stage growth model of
intrinsic value to two dividend paying stocks.
Stock A is a software company that has a product that is
currently unique and will take at least two years for the
competition to catch up with.
Stock B has near monopoly power in its industry for the
for-seeable future.
Both stocks have abnormal growth forecasts that are greater than
economy wide growth rates.
Which stock would you apply the larger number of years for in
stage 1 of a two stage dividend growth model?
Provide reasons in support of your answer.
Question 27:
What is a “Blume adjusted beta? Provide a brief description
of the supporting reasons for this adjustment to beta.
Question 28:
Suppose you were applying a two stage dividend growth model
to assess the intrinsic value of a stock using CAPM to estimate the
cost of equity capital.
When would you use a Blume adjusted beta to estimate the stage 2
cost of equity capital?
Real World Exercise: Growth Behavior
Select two
companies from the Current FTS Dataset that are competitors, or at
least are in the same industry even if they do not directly compete
with each other.
Refer to
Valuation Tutor’s Degree of Total Leverage section:
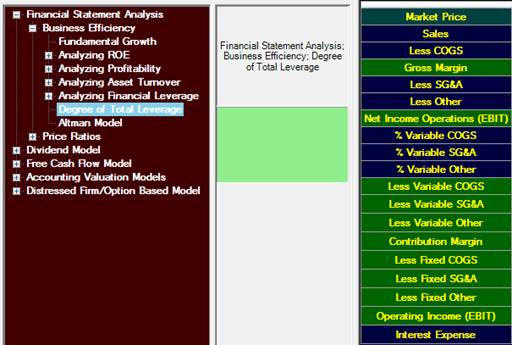
Step 1:
Estimate the degree of total leverage for your two stocks by
first estimating the % Variable COGS, % Variable S&GA and % Variable
Other. To estimate this
refer back to your understanding of their business model (see
chapter 1) and refer back to the questions in Chapter 2 that work
through the three methods for assessing cost behavior.
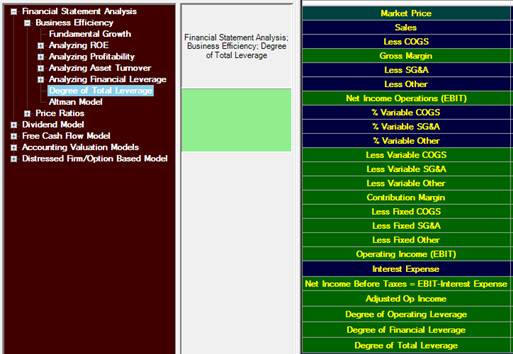
By applying any one of these techniques to your two stocks
you can then calculate their:
Degree of Operating Leverage, Degree of financial Leverage
and Degree of Total Leverage by using the above calculator and
clicking on Calculate:
Step 2:
Forecast Sales growth for your two companies.
You can work with their current 10-K Consolidated Income
Statement and bring it into Excel (check Chapter 1 for details how).
This will
provide you with the last three years of sales growth.
As a first pass estimate what you think the sales growth is
from these last three years. (e.g., Sales Year 3 = Sales Year
1*(1+g)^2). You may
want then modify this estimate using current information at hand.
Step 3:
Finally forecast growth in Earnings by multiplying your
estimate for the degree of total leverage times the sales growth
forecast.
Step 4:
Now refer back to Valuation tutor and select the analyst
section:
Check out the
growth forecasts for your stocks from MSN and Yahoo and contrast
these forecasts with your own estimates from step 3.
Finally on the basis of all information – your own analysis
and the consensus forecasts what do you predict abnormal growth to
be for your two stocks?
Step 5:
Assess what you expect normal growth to be for your two
stocks. Provide brief
reasons in support of your answer.
Real World Exercise: The Cost of
Equity Capital
For the same
two stocks as the previous exercise, estimate using Valuation Tutor
the cost of equity capital using both CAPM and MCPM: