
6.13 IBM Example
Our
historical analysis of IBM suggested a growth rate of dividends of
8. This is higher than
the economy’s growth rate, and was greater than the discount rate,
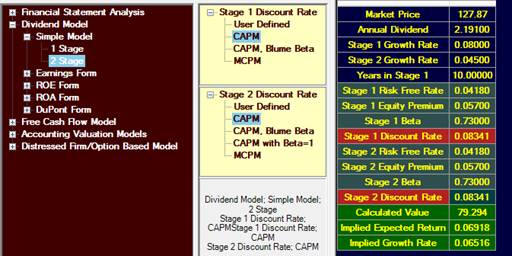
so we could not use this in the one stage model. Let’s see how the
two stage model values IBM if the first stage growth rate is 8% and
the remaining parameters are as shown on the screen:
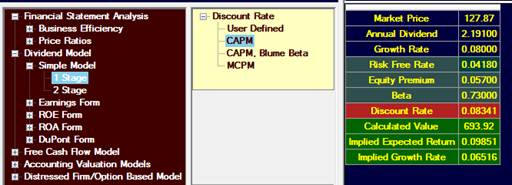
Compare this to
the one-stage model with the same parameters:
You can see
impact of limiting the second stage growth rate on the valuation.
When you
calculate the two stage model, Valuation Tutor provides you with the
details of the calculation:
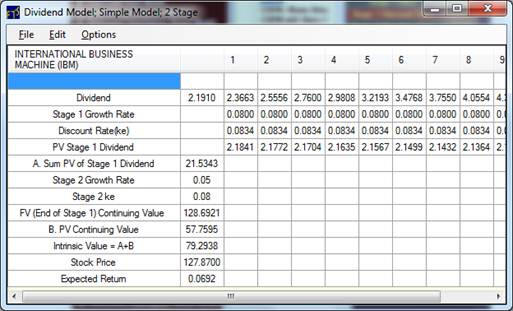
This shows you
exactly how the values are calculated, and serves as a reference
point for understanding the details.
You can export this into Excel and see if you can verify the
steps of the calculation.
Projecting Future Prices
As we noted
before, Valuation Tutor also reports the implied expected return.
One way to use that number is to project future prices.
For example, if the current price is $100 and the expected
return from the valuation model is 10%, then you have a projected
price, or a price target of $110 in one year.
Criticism of Model 2
The two stage
model is a clear improvement over the one stage model particularly
because it lets us restrict long term growth in an economically
meaningful manner.
But three major
limitations remain:
i.
The model only applies to stocks that pay dividends and have a
stable dividend policy.
But many companies have a more complex dividend policy that consists
of both accounting dividends and Treasury stock purchases.
These purchases create important changes to shareholders
equity that are not accounted for in the dividend model
ii.
Implicit in the model is the assumption that the firm is a going
concern. Some firms may
be distressed, and the model will not be useful for these companies.
iii.
The model is clearly not applicable to a non-dividend paying stock.
In the next
chapters, we introduce extensions of the dividend model that can
overcome some of these limitations.
These are the free cash flow to equity model, residual
income model and the abnormal earnings growth model.
In Chapter 8, we study a model specifically applicable to
distressed stocks.