5.8 Tutor Reconciliation:  Proctor and Gamble (PG)

Step 1:  
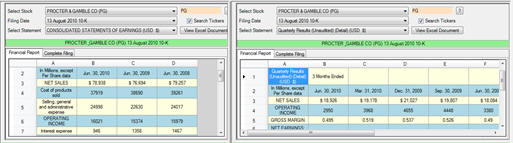
Refer to section 5.2 to bring up the Income Statement and Balance Sheet for Proctor and Gamble as described in section 3.2.  Be sure to 
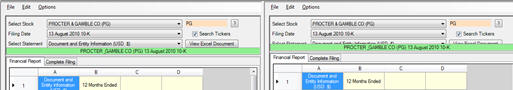
select the August 13, 2010 10-K from the dropdown.  This is displayed at the bottom of the screen as follows:
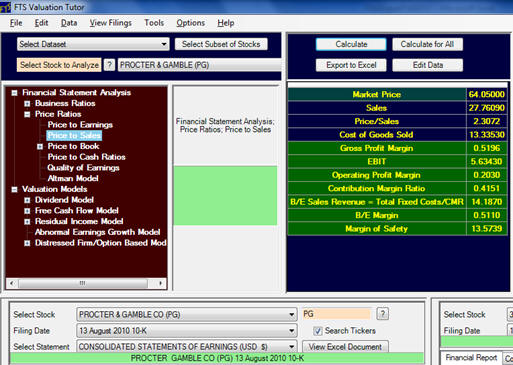
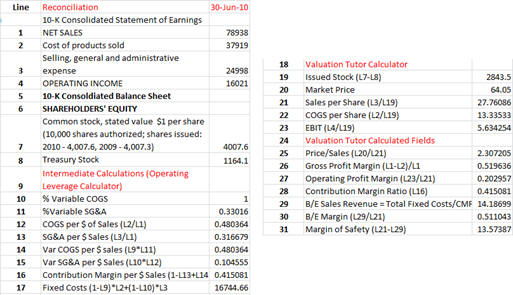
 

We can reconcile Price to Sales by selecting the Consolidated Income Statement as follows (LHS of screen):


Step 2:  Refer to the calculator part of the Valuation Tutor screen.  Click on Calculate and this has computed the Price to Sales Ratio from the following fields:


You can observe above the additional derived fields are:

Sales per Share = $27.761

Price to Sales = 2.3072

COGS per Share = $13.335

Step 3:  Where did these numbers come from including the additional Break Even Analysis?

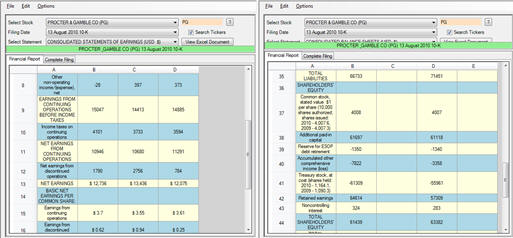
Valuation tutor software lets you quickly compare both sources:


In the LHS we have already got up the interactive consolidated income statement.  Now consider the bottom RHS of the screen.  By selecting the report Quarterly results you can see the last 10-quarters Sales revenue for P&G which provides insight into the seasonality of a firm’s sales. 

You can cross check with the interactive annual statement.