
6.16 Developing Professional Judgment
using Decile Analysis
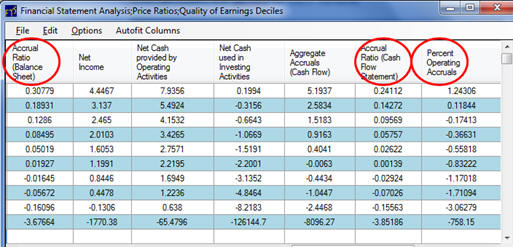
How Can You Interpret Earnings’ Quality Numbers?
Recall, in the earlier WMT example as well as in the above P&G
reconciliations we observed some negative measures for earnings
quality. How
does this compare with other firms?
In this section we will use the latest financial statement data
available for these firms to illustrate how to interpret these
ratios.
First, read in the entire dataset into Valuation tutor:
Step 1:
Click on the menu item Data and select Download Data:
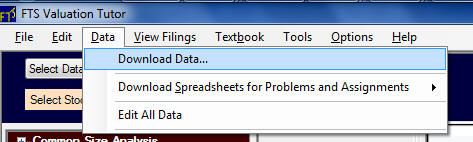

Followed by clicking on Download the FTS Dataset:

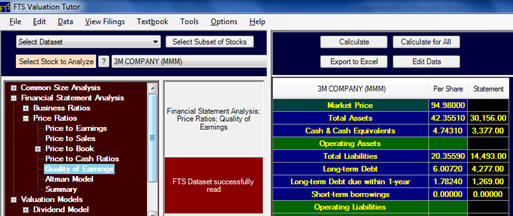
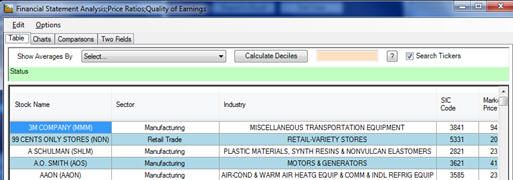
Now select Quality of Earnings and then click on Calculate for
All (the button depicted below):
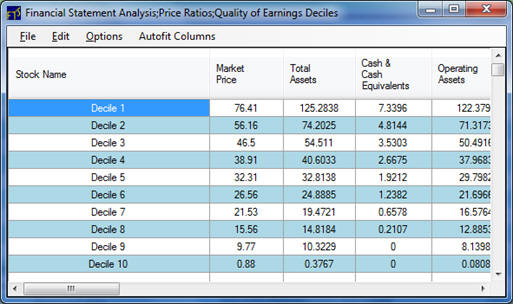
Now consider where WMT and PG currently lie?
By entering the Ticker WMT you can see that currently (2011 10-K
WMT’s earnings’ quality ratios are:
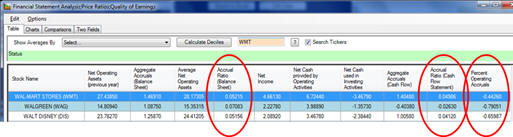
That is,
Aggregate Accruals (Balance Sheet) is 0.05215 in the 5th
decile,
Aggregate Accruals (Cash Flow) is 0.04986 in the 5th
decile,
Percent Operating Accruals is -0.4426 in the 5th
decile,
That is, for Wal-Mart currently all three measures produce the
same decile ranking.
But this is not the case for P&G for which the 10-K 2011
rankings are:
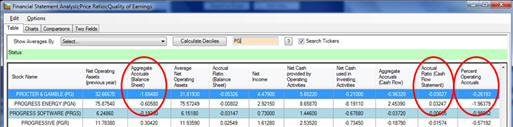
Aggregate Accruals (Cash Flow) is -0.03027 in the 8th
decile,
Percent Operating Accruals is -0.26193 in the 4th
decile,
That is, for PG the two asset based measures produce a more
favorable ranking than does the income scaling metric.
However, no flags are raised for either Wal-Mart or Proctor and
Gamble from the earnings quality ratios.
The above exercise is designed to reinforce the
importance of assessing ratios relative to some benchmark.
This is because the absolute number does not communicate
a whole lot by itself.