
5.5 Example: KO
versus PEP and the PEG Ratio Using Consensus Analyst Forecasts
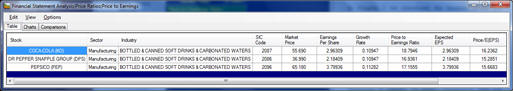
The current analyst
earnings forecasts midway through 2010 were:
From the earlier example
the Forward P/E Ratios for KO and PEP were:
Forward P/E Ratio
KO = $52.67/$3.43 = 15.36
Forward P/E Ratio
PEP = $64.57/$4.17 = 15.48
The forward P/E
ratios for these two similar stocks are similar.
Forward PEG Ratio
KO = 15.36/9 = 1.71
Forward PEG Ratio
for PEP = 15.48/10 = 1.55
The market is valuing growth more highly for KO than PEP.
Earlier 2010 KO had implemented a major shift in its
investment strategy by acquiring its bottling plants.
This brought KO in line with PEP’s investment strategy.
It was designed to
provide KO with a lot more marketing/production flexibility by
being able to more quickly respond to regional pricing and
labeling adjustments required to counteract PepsiCo’s
strategies. As a
result, the market appears to be pricing in a higher potential
for KO’s growth than was currently the case for PEP.
Did KO achieve its
potential?
In the next example we
shift forward in time and illustrate how to work with Quarterly
Financial Statements to construct current price ratios.
Valuation Tutor and Quarterly Financial Statements
In practice there are
different types of P/E ratios.
For Coca-Cola, Dr Pepper and PepsiCo:
P/E Ratio = Stock
Price/Annual Earnings per Share
Trailing P/E Ratio
= Stock Price/Sum of last four quarters
Forward P/E Ratio =
Stock Price/Forecast Earnings per Share
The advantage of the
second versus the first is timeliness.
For example, in May 2010, the first quarter financial
results are available and so the trailing four quarters are Qtr
1, 2010, Qtr 4 2009, Qtr 3 2008, Qtr 2 2009.
The third ratio looks ahead; the 1 year forecast is for
2010 covers Qtr 1 2010, Qtr 2 2010, Qtr 3 2010 and Qtr 4 2010.
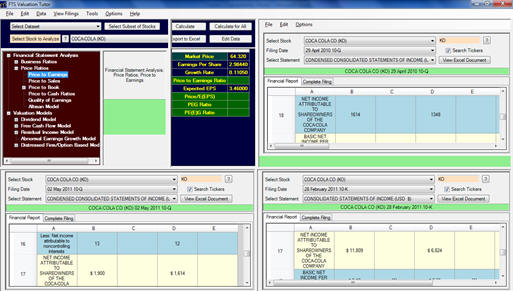
Step 1:
Click on View Filings and
select SEC Filing Viewers at Bottom and then select SEC Filings
Viewer at Right.
This lets you bring in the required three statements
simultaneously.
Step 2:
Filing Date select the following three dates
respectively.
02 May 2011 10-Q (3-months
ending April 1, 2011);
28 February 2011 10-K (12-months ending Dec 31, 2010);
29 April 2010 10-Q (3-months ending April 2, 2010)
Trailing Twelve Months
(TTM) = April 1, 2011 (3-months) + (Dec 31, 2010 (12-months) –
April 2, (3-months);
Computing TTM Net Income
Attributable to KO Shareholders = $1900 + ($11,809 - $1,614) =
$12,095.
June 30, 2011 KO closed at
$67.29 per share and from the 10-Q Balance Sheet for April 1,
2011 the latest estimate of shares outstanding was:
3,520 less Treasury Stock equal to 1,233 = 2,287
The TTM EPS =
$12,095/2,287 = $5.2885
P/E (Trailing 12-months
June 30, 2011) = 67.29/5.2885 = 12.72.
The consensus 5-year’s
growth forecast for KO around this time 9.0% and so the PEG
ratio is:
PEG (Trailing 12-months
June 30, 2011 = 12.72/9.0 = 1.41.
Since the earlier example,
KO’s stock price has increased along with its earnings.
Overall current P/E ratios have fallen including the PEG
ratio.
Suggested Exercise:
Compute the TTM P/E and PEG ratios for PepsiCo and Dr
Pepper Snapple to assess which stock is relatively cheaper.
PEP’s 5-year growth forecast is 8.3%, June 30 closing
price = $70.43 and DPS is 10.5% and June 30 closing price =
$41.93.