
Chapter 5:
Financial Statement Analysis: Price Ratios
In this chapter, we extend
ratio analysis to price
based ratios. A
major difference between business ratios and price ratios is
that emphasis now shifts to forward looking analysis.
The market price of a stock reflects future performance
(i.e., expected return) and discounts this expected return by
assessing a company’s risk.
As a result, price ratios represent the market’s
scorecard of how the company is performing along the set of
dimensions covered in Chapter’s 3 and 4
taking into account forward looking information.
Figure 1:
Price Ratios
The market’s scorecard
includes assessing the quality of the accounting earnings and
the credit risk of the firm.
There have been persistent questions raised in accounting
research on whether the market correctly assesses earnings
quality. This
research studies the use of and relative importance of
accounting accruals to accounting net income measures.
Because accounting accruals must reverse over time these
studies have implications for assessing both the expected return
and the risk of a company.
The Valuation Tutor software performs a comprehensive
analysis of earnings quality working directly with current
accounting disclosures.
The credit rating models assess whether a company is a
going concern or is a distressed firm and calculates the
likelihood that a firm going to go bankrupt.
We start with price
ratios. Extreme
price ratios usually provide a signal that forward looking
information, beyond standard financial disclosures, is
significant. Recall
from Chapter 2 that the MD&A section of the 10-K has been
subjected to criticism.
A recent SEC study concluded that forward looking
information disclosures can be improved.
As a result, studying price ratios is an important means
of assessing whether the MD&A and related sources should be
subjected to closer scrutiny.
Perhaps the most famous
price-based ratio is the Price to Earnings (P/E) ratio, which is
the price of the stock divided by the earnings per share.
This ratio measures the amount investors in the market
(or simply the “market”) are willing to pay per dollar of
earnings per share.
If you compare the P/E ratio of two firms, you could infer that
investors who buy the stock feel that the stock with the high
P/E ratio has stronger growth prospects.
A stock with a higher P/E ratio is said to be more
expensive than one with a lower P/E ratio because you have to
pay more per dollar of earnings for that stock.
Sometimes, the ratio is expressed in terms of a multiple;
if a stock’s P/E ratio is 15, then we say that the stock is
trading at a multiple of 15, or that the price is 15 times the
annual earnings per share; a stock trading at 20 times earnings
is then more “expensive” than one trading at 15 times earnings.
The usual reasons for such differences are expected
earnings’ growth and/or risk.
Analyzing differences in
earnings’ growth leads to another popular measure which is the
PEG, or P/E to Growth, ratio.
That is, the P/E ratio is divided by the expected growth
of earnings.
Generally, we expect that companies with a high P/E ratio will
grow faster, and so simply comparing them on the basis of the
P/E ratio would make us think that the high growth stocks are
expensive. The PEG
ratio normalizes the P/E ratio by the growth rate, and therefore
makes companies with different growth rates more comparable and
which then lets an analyst explore issues such as earnings’
quality, degree of operating leverage and other sources of risk
that can influence earnings.
In principle, you can
construct a price based ratio using any of the firm’s
activities, for example, the Price-Sales Ratio or the Price-Cash
Flow ratio.
Each such ratio tells you how the market evaluates or “prices”
or “values” that activity.
We can then make inferences about firms by ranking these
measures. This gives
you a “market scorecard” of the activities of the firm, and
tells you which activities are the drivers of the firm’s value.
In other words, price ratios provide the markets evaluation of
the firm’s business model and strategy.
Given your understanding
of the firm’s business strategy the market should value
activities that are important to the strategy if implemented
efficiently. By
adopting this line of reasoning you can see how price ratios
become an important source of information to firms today that
faces dynamic value chains as described in Chapter 4.
The specific learning
objective is:
·
To understand the major price based ratios, how to construct
them from the firm’s financial statements, and how to interpret
them
The chapter proceeds by
introducing the most popular of all price based ratios, the
Price to Earnings Ratio.
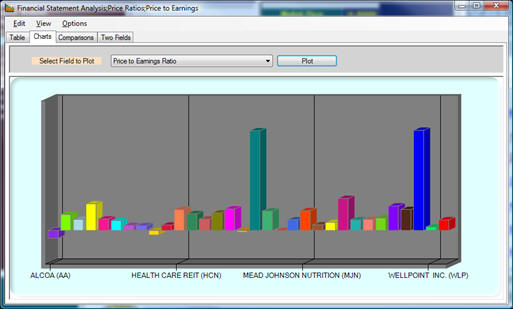
The following chart shows the P/E ratios for the stocks
in the Dow Jones Industrial Average at the time of this writing.
This “bottom line” ratio
is extended to the Price Earnings to Growth (PEG) ratio.
This measures the market’s assessment of both financial
and learning and growth perspectives of the firm.
We then proceed to the “top line” with the Price to Sales
Revenue ratio which measures the market’s assessment of the
customer perspective.
Next we introduce the Price to Book Value of Equity
ratio, and show that by decomposing this ratio further, we
obtain important measures of how the market prices the various
internal activities of the firm.
Finally, we introduce the Price to Cash Flow Ratio in aggregate
and decomposed forms.
Compared to the Price Earnings Ratio, this provides
insights into the quality of accounting earnings and the
decomposed forms allow additional information to be extracted,
such as how the market is pricing working capital management and
capital investment decisions made by the firm.
If earnings management is an issue, then price to cash
flow ratios may provide what on the surface appears to be an
inconsistent picture.
After price ratios, we take you through a detailed analysis of
earnings quality, and conclude the chapter with an analysis of
credit ratings.
Before starting into the
ratios, the next section provides the common set of steps
required to recreate each of the formal Proctor and Gamble
reconciliations directly from the 10-K filings for each ratio.
This follows the format introduced in Chapter 3 for the
Business Ratios.