
5.7 Price to Sales Ratio
Price/Sales Ratio
is a measure of the
number of
years to recover the stock price with zero sales
growth.
|
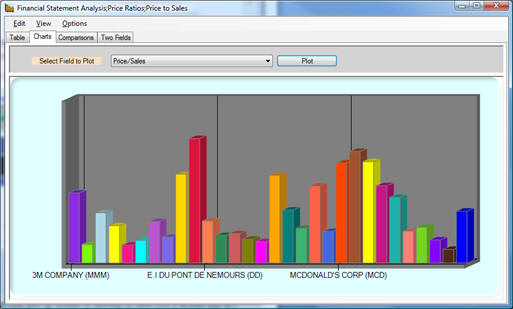
The price to sales ratio divides the stock price by sales per
share. This
multiple can then be applied to identify the relative value of
similar stocks. The
following plot from Valuation Tutor shows you the Price to Sales
Ratio for the stocks in the Dow Jones Industrial Average:
One rationale for working with the price to sales ratio is that
Sales Revenue is the top line of the income statement and thus
potential less subject to manipulation.
However, even though this top line item is usually subject to
less potential manipulation care must still be taken to read
item 7 in the 10-K, specifically the “Management’s Discussion
and Analysis (MD&A) and Forward Looking Statements, and Critical
Accounting Policy” section.
This section often provides a discussion of the stock’s
revenue recognition criteria.
Revenue recognition is subject to manipulation, and some
interesting insights into are provided by Mary-Jo Rebelo in
The Effect of the Dot-Com
Decline on Independent Accountants (The CPA Journal, May
2003).
“Revenue
recognition tops the list of creative accounting techniques
employed by many dot-coms. The decision to capitalize or
expense is inextricably intertwined with this point. A
company defers as many costs as possible. Capitalized costs
are reported as an asset on the balance sheet rather than an
expense on the profit-and-loss statement. Never before has
an entire industry had sales matter so much to its lenders
and investors.
For a website trading at 200 times expected sales, even a
small increase in reported revenues can translate into a
dramatic increase in market capitalization. Here are a few
examples of how it can be done:
The gross-up. Many dot-coms gross up revenues by reporting
the entire price a customer pays at their site even though
the company may actually keep only a small percentage of
that total amount.
Contra deals or barter. This method involves booking revenue
ahead of when the sale actually occurs. A dot-com exchanges
advertising space on its website for advertising space on
another to build brand recognition and use up excess
advertising capacity without using cash. GAAP requires
recording barter transactions at fair value, but does not
specify how to determine fair value. Many dot-coms have
treated such barter advertising deals as a sale, thereby
accelerating revenue as well as expenses.
Expenses. Dot-coms often manipulate the categorization of
expenses in an effort to report a more favorable operating
performance. Because dot-coms rarely report net profits, the
focus is on gross profits before the deduction of indirect
expenses. Dot-coms try to minimize direct expenses by
reclassifying them as indirect. The primary area for abuse
is coupons or discount vouchers, which are reported as
indirect expenses. By reducing direct expenses while
increasing indirect expenses, the company breaks even at the
gross profit level even though net losses are the same.
Additionally, fulfillment costs, the expenses associated
with warehousing, packaging, and shipping products, are used
in creative accounting.
Companies usually record fulfillment costs as a cost
of sales, but dot-coms classify fulfillment costs as a
marketing expense. This categorization allows dot-coms to
conceal operational expenses within the hefty marketing
costs that lenders or investors likely believe are
associated with establishing brand awareness.
Once these creative accounting techniques are combined, the
profit picture looks more promising. When dot-coms have
crashed, the creative accounting employed in an effort to
enhance financial performance has often been placed in the
lap of the outside accountant or auditor to explain and
justify.”
For this sample of stocks, observe the relationship between the
Price/Sales ratio and the Gross Margin.
It is clear that profit margin is a major driver of the
Price/Sales Revenue Ratio.
As a result, if there is a significant departure from
this relationship an analyst would use this as a flag that there
may be issues associated with how the company is recognizing its
sales. In the
previous section we summarized some of the revenue recognition
issues that can be explored if the price to sales ratio raises a
flag.