
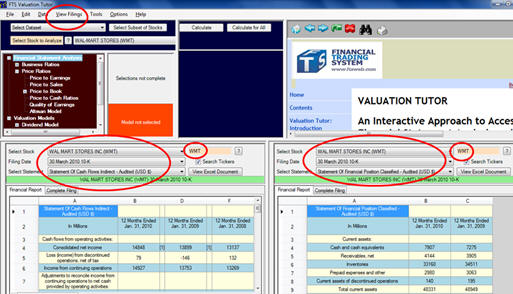
5.14 Example Wal-Mart
Following section 5.2 we
bring in the Consolidated Balance Sheet for WMT.
The key elements of the screen are circled below for this
example. That is we
are working with the 30 March 2010 10-K and Wal-Marts
Consolidated Balance Sheets for the years ending January 31,
2010 and 2009.
Computation of Net Operating Assets Jan 31, 2010
Note to the above 10-K:
Following FASB Statement 160 (ASC 810-10) the FASB has
recently (beginning on or after December 15, 2008) required that
“non-controlling interests” are part of equity in a consolidated
reporting entity.
This is a departure from the previous practice of treating
minority interests as a mezzanine item between liabilities and
equity. This
has resulted from the convergence process between US GAAP and
IFRS and in particular aligns reporting of non-controlling
interests with the requirements in IAS27.
This convergence adopts a
single method of accounting for economically similar
transactions. It eliminates the need to apply purchase
accounting to a parent’s acquisition of non-controlling
ownership interests in a subsidiary, and thus eliminates the
need to value the assets and liabilities of the subsidiary on
the date that each additional interest is acquired.
In the numbers below we
will keep non-controlling interests in the equity section.
Prior to the latest requirements of statement 160 some
analysts may have included non-controlling interests in Total
Liabilities (e.g., via Total Assets – Equity type of
calculation) and you can easily edit any of the numbers in the
calculator if desired.
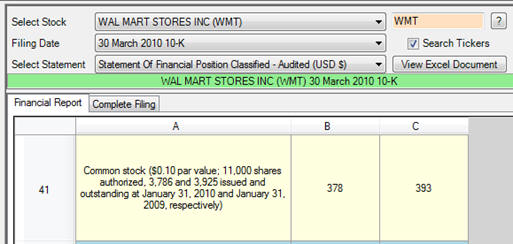
Working from Wal-Marts 10-K
Shares Issued and
Outstanding Jan 31, 2010 = 3,786
Total Assets =
170,706 (2009), 163,429 (2008)
Cash and Cash
Equivalents = 7,907 (2009), 7,275 (2008)
Operating Assets =
170,706 – 7,907 = 162,799 (2009), 163,429 – 7,275 = 156,154
(2008)
Adjusted
Liabilities2009
= Total Liabilities and Equity2009 –
Total Equity2009 = (170,706 – 72,929) – (33,231 +
4,050 + 523) = $59,973
Adjusted
Liabilities2008
= Total Liabilities and Equity2008 –
Total Equity2008 = (163,429 – 67,079) – (31,349 +
5,848 + 1,506) = $57,647
Net Operating
Assets2009 = 162,799 – 59,973 = 102,826
Net Operating
Assets2008 = 156,154 – 57,647 = 98,507
Aggregate Accruals
= 102,826 – 98,507 = 4,319
Average Net
Operating Assets = (102,826 + 98,507)/2 = 100,666.5
Accruals Ratio
(Balance Sheet) = 4,319/100,666.5 = 0.0429 or 4.3%
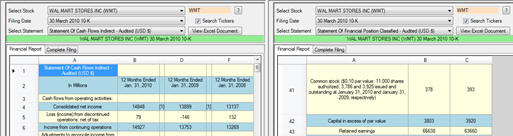
Online you can verify the
above numbers from the Consolidated Balance Sheet as in the
example below:
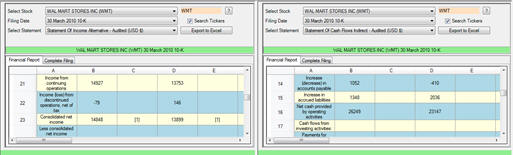
Aggregate Accruals
Aggregate Accruals2009
= Net Income2009 – (Cash Flows from Operations + Cash
Flows from Investments)
Refer to the Consolidated
Cash Flow Statement for Wal-Mart.
This is in the LHS of the screen below:
The Aggregate
Accruals for 2009 are:
14,848 – (26,249 + (11,620)) = 298
Accruals Ratio
(Cash Flow Statement) = 298/100,666.5 = 0.00296
Finally we can construct
the Percent Operating Accruals for Wal-Mart as follows:
Percent Operating
Accruals = (Net Income – Cash from Operations)/Net Income
Percent Operating
Accruals = (14,848 – 26,249)/14,848 = -0.76785
In other words, Wal-Mart
has negative accruals which is a very positive signal for
underlying strength of future earnings given the empirical
findings from Hafzalla, Lundholm and Winkel (2010).
You can verify these numbers from the statements below:
But how can you determine
what is high versus low quality?
The answer to this is an
empirical issue that is often handled by forming portfolios
ranked in terms of the ratios.
Valuation Tutor lets you do this directly by clicking on
Calculate All and then sorting the results provided in the grid
that automatically pops up.
This lets you compare important ratios by SIC code,
industry or even stock index classification.
In the next section we will first introduce Valuation
Tutor’s Earnings’ Quality calculator and use it to reconcile the
numbers for P&G. We
will then extend the use of this calculator to see how to
develop your professional judgment in relation to the numbers
produced by exploiting the feature “Calculate All.”