5.3 Price to Earnings
Ratio
P/E Ratio
is the number of years to recover the stock price
with zero earnings growth
|
The Price Earnings Ratio divides the stock price by earnings per
share (EPS). This
multiple can be used to identify the relative value of similar
stocks. There are
three different types of P/E ratios commonly used in practice:
i.
P/E Ratio = Stock
Price/Annual Earnings per Share (EPS)
ii.
Trailing P/E Ratio = Stock
Price/EPS computed from the sum of last four quarters
iii.
Forward P/E Ratio = Stock
Price/Forecast Earnings per Share
Relative valuation
uses these ratios to rank similar stocks such that the lower the
ratio the higher the ranking.
A ratio is defined relative to annual earnings measures
of the number of years required to recover the current stock
price from earnings if there is no earnings growth.
The three types of price
earnings ratios defined above vary in terms of the timeliness
and relevance of the relative valuation ranking.
For example, the Trailing P/E Ratio provides more timely
information because the Trailing P/E Ratio constructs annual
earnings per share number from the most recent available four
quarters.
Role of Growth Forecasts
Stock prices reflect
expectations about the future.
The Forward P/E Ratio is a refinement of the Trailing P/E
Ratio because it incorporates expectations about future earnings
into the analysis. A
potential weakness with this is that only the next year is taken
into account, while a stock price will reflect earnings
expectations about future years as well.
One refinement of the P/E ratio designed to incorporate
this idea is the Price/Earnings to Growth Ratio (PEG) Ratio.
Here Growth is usually defined as the expected Growth
over the next 5-years to overcome this problem.
PEG Ratio = P/E
Ratio divided by Growth
Again, this ratio is
interpreted relative to a similar stock or set of stocks in an
industry. All other
things being equal, the stock with a lower PEG ratio is ranked
higher than a similar stock with a higher PEG ratio.
We illustrate these ideas
next for a small set of well known stocks with similar business
models.
Tutor Reconciliation:
Proctor and Gamble (PG)
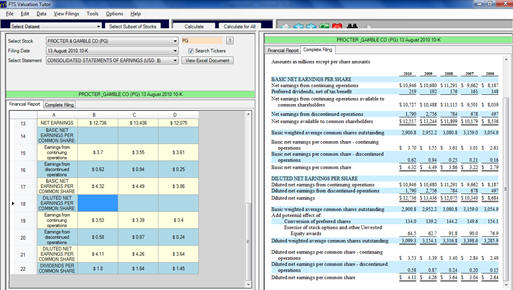
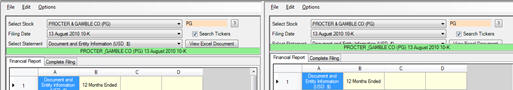
Step 1:
Refer to section 5.2 to bring up the Income Statement and
Balance Sheet for Proctor and Gamble as described in section
3.2. Be sure to
select the August 13, 2010 10-K from the dropdown.
This is displayed at the bottom of the screen as follows:
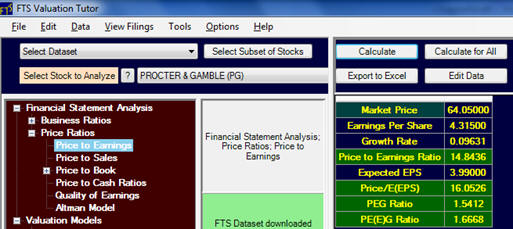
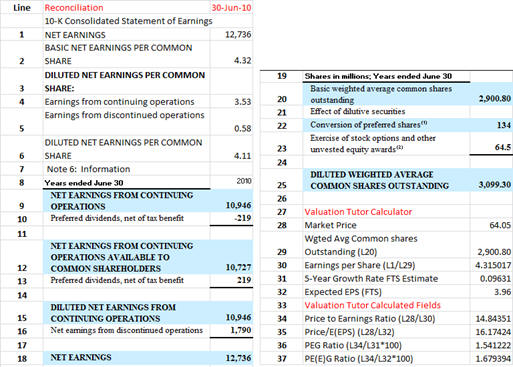
Earnings per Share = $4.315
5-Year Growth Rate = 0.0963
Price = $64.050
Price to Earnings Ratio = $64.050/4.315 = 14.84
Expected EPS = 3.99 (Note: this is next year which can be a
forecast decline even though the next five years is forecast to
be positive 9.63%)
Price /E(EPS) = $64.05/3.96 = 16.05
PEG Ratio = 14.84/9.63
PE(E)G Ratio = 16.17/9.63
Step 3:
Where did these numbers come from?
Unfortunately in the financial statements there are many
variations of the EPS!
For example, both the numerator Earnings, and denominator
number of shares can take different values.
The main point is that so long as you are consistent
across stocks then relative pricing is relevant.
However, this is one of those numbers where additional
analysis is required.
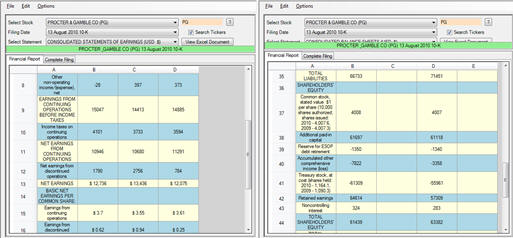
The accountants realize this and full details are
provided in the 10-K as well as the interactive statements.
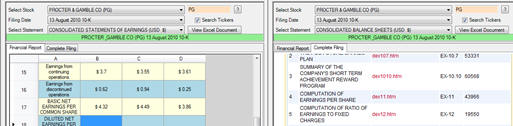
Valuation tutor software lets you quickly compare both sources:
In the LHS we have already got up the interactive consolidated
income statement.
Now consider the bottom RHS of the screen.
If you click on the tab Company Filing you are taken
immediately to the company filings as depicted below: