
9.12 Questions
Question 1:
The residual income approach to
valuation and the abnormal earnings approach to valuation differ
in terms of their relative emphasis upon the balance sheet and
income statements.
Which technique places more emphasis on the income statement?
Provide support for your answer.
Question 2:
Residual
income and Normal Earnings exploit the economic concept of an
“opportunity cost.”
Describe how each concept exploits the concept of an opportunity
cost including how they differ in how they measure opportunity
costs.
Question 3:
Describe in words what Normal
Earnings is.
Question 4:
What is Cum-Dividend Earnings?
Question 5:
Explain how the economic
concept of opportunity costs is applied to the concept of
Cum-Dividend Earnings.
Question 6:
Define abnormal earnings growth
and describe its meaning in your own words.
Question 7:
Explain precisely how the
economic concept of opportunity costs is applied to the concept
of abnormal earnings growth.
Question 8:
What is the relationship
between abnormal earnings growth and the concept of residual
earnings?
Question 9:
Suppose you are assessing the
intrinsic value of a firm that pays zero accounting dividends.
Can you apply the abnormal earnings growth model to this
firm? Provide
reasons in support of your answer.
Question 10:
When computing the intrinsic
value of a stock using the abnormal earnings growth model an
analyst identifies the earnings to be capitalized in perpetuity
and divides by the discount rate (i.e., the cost of equity
capital). What are
the three components that make up the earnings to be capitalized
in this model?
Question 11:
Describe in words what is the
Present Value of Abnormal Earnings Growth at time t.
Question 12:
Describe in words what the
Present Value of Continuing Value at time t is.
Data for next few questions
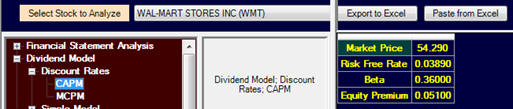
For Wal-Mart, assume the following inputs
for CAPM:
The following additional information
contains the Consolidated Statement of Shareholder’s Equity and
Consolidated Income Statement for Wal-Mart from their 2010 10-K
filed with the SEC:
Excerpt from the Consolidated Statement
of Financial Position (Year ending Jan 31, 2010, Jan 31, 2009
respectively)

Additional Information: Total Walmart shareholders’ equity for year end Jan 31, 2008 = $64,608
Additional Information:
Total Dividends Paid
Year ending Jan 31, 2010
$4271, Year Ending
Jan 31, 2009
$3746, Year Ending
Jan 31, 2008 $3586
Non-controlling interest:
Year
ending Jan 31, 2010 2180, Jan 31, 2009 1794 and Jan 31, 2008 not
reported
Question 13:
By referring to the
information available for this question calculate Comprehensive
Income and Comprehensive Income per share for the purposes of
valuing Wal-Mart for 2009.
Provide brief reasons in support of your answer.
Question 14:
Calculate the Dividend Payout
Ratio relative to Comprehensive Earnings for year ending January
2010. (Assume that
outstanding common stock is the ending balance of share for Jan
2010 provided).
Question 15:
Assuming CAPM and the data
provided calculate Wal-Mart’s Normal Earnings for 2010.
Question 16:
Assuming CAPM and
the data provided calculate the Cum-Dividend Earnings for
Wal-Mart for 2009.
Question 17:
Assuming CAPM and the data
provided calculate the 2009 Abnormal Earnings Growth for
Wal-Mart.
Question 18:
Assume the CAPM data provided
remains constant over time, calculate the difference between
Residual Income for 2009 and 2008.
Question 19:
In the light of your answers to
the two previous questions are they consistent with what the
predicted relationship is between Abnormal Earnings Growth for
2009 and the difference between Residual Income for 2009 and
Residual Income for 2008.
Question 20:
Compute the ROCE
(Return on Common Equity) for the year ending Jan 31, 2010 using
Comprehensive Income for Wal-Mart.
Real World Exercise: Assessing
Intrinsic Value Using the Abnormal Earnings Growth Model
Approach to Estimating Intrinsic Value
Select two companies from the Current FTS
Dataset that are competitors, or at least are in the same
industry even if they do not directly compete with each other.
Prepare an analysis of each stock’s
intrinsic value by applying the Abnormal Earnings Growth Model
of Intrinsic Value. You
should identify the major inputs you need from the Valuation
Tutor’s Calculator.

This model requires estimating the growth
rates for projecting Comprehensive Income 1 year ahead, 2-year
ahead and for the next n-years depending on how many years you
define stage 1 to be and then finally the normal growth rate.
In addition, you need to assess the discount rates (i.e.,
cost of equity capital inputs).
It is recommended that you first refer to the real world
projects at the end of chapter 4 when completing these parts.
Identify the major inputs required to
assess the intrinsic value using the Abnormal Earnings Growth
approach including the important assumptions you have made to
come up with this assessment.
You should discuss issues that arose when implementing
this model. That
is, what are the critical variables that underlie your analysis
and how reliable do you assess your estimates for these
variables to be when valuing your two stocks.
What is the intrinsic value for your two
stocks and what is your forecast of Expected Return (Implied
Expected Return in the calculator).
These are the calculated values from the Valuation Tutor
calculator. In
addition, the support working for how these numbers were arrived
at is provided in a support window.
You are encouraged to refer to the text to understand
where these numbers have come from.
Bottom Line Requirements:
1.
What is
your bottom line analyst recommendation for your two stocks?
This should be a recommendation that can range from
Strong Buy, Moderate Buy, Hold, Moderate Sell, and Strong Sell.
2.
What is
you forecast for the future stock price in 1-year’s time?
Hint: Apply
the Expected Return calculated in Valuation Tutor and multiply
by the spot stock price such that the forecast price equals P *
(1+E(Return)^1-Year