
9.1 Abnormal Earnings Growth Model
In
Chapter 3, we introduced one of the most popular accounting
ratios, the ROE (Return on Equity), and showed you how this
ratio is related to growth (and is sometimes called “fundamental
growth).
In the last chapter, you studied the RIV model, where the
focus is on the book value of equity; in fact, we motivated the
model in this way.
Most analysts, however, focus on earnings.
The P/E ratio is used as a valuation tool (the value
equals expected earnings times the multiple).
The relationship between earnings and intrinsic value is
the subject of much research, and some references include
Williams (1938), Modiagliani and Miller (1958), Ohlson (1995)
and Ohlson and
Juettner-Nauroth (2005).
The more recent works study the relationship between
earnings and value under names like the Abnormal Earnings Growth
model (AEG) and the “OJ” model.
In some ways, we have come full circle; we started with a
cash-based model (the dividend model) and extended it to the
free-cash flow model.
Then we moved to the RIV model and shifted the focus to
the book value; we now return to earnings, which lie at the
heart of cash flows and growth in shareholder equity.
The Abnormal Earnings Growth model carries along with it the
clean surplus relationship and comprehensive earnings.
Under clean surplus, there is an implied equivalence
relationship between AEG and the change in Residual Income,
which this chapter demonstrates.
So you may ask: what is the contribution of AEG over and
above the Residual Income model?
If they are analytically equivalent, then why not just
apply the Residual Income model?
One answer to this question is that implementations of
the two models can lead to multiple estimates of intrinsic
value because real world imperfections imply that clean surplus
will not literally hold.
A second is that the AEG model provides different
insights into what drives firm value by focusing on earnings
rather than book value.
The growth behavior of a firm in practice is complex and
difficult to estimate.
In Chapter 1, we introduced the business model and
business strategy, and you saw that growth behavior in the real
world is both dynamic and complex.
In Chapter 3 we introduced the concepts of fundamental
growth and the degree of leverage, the latter under a simple
(fixed versus variable) cost behavior assumption.
These concepts provide methods for estimating growth
directly from firm fundamentals.
In Chapter 3 and later, you saw that analysts provide
discrete forecasts of growth behavior that you can access easily
within Valuation Tutor.
These forecasts are for a specific set of times ahead,
1-quarter, 2-quarters, and 1-year, 2-year and 5-year forecasts.
However, imperfections in the market, such as
information, measurement and aggregation imperfections, result
in different approaches (analyst versus fundamentals) often
providing very different growth estimates.
In fact, most growth estimates rely upon simplifying
assumptions. For
these reasons the clean surplus relationships are unlikely to
literally hold in the real world in the presence of dynamic and
complex growth behavior, and the implementation of the two major
accounting valuation models in practice will lead to different
assessments of intrinsic value.
When resolving these issues, equity analysts use their judgment
combined with their knowledge of the business model, business
strategy and how these affect financial statements.
For example, RIV often applies to firms whose business
model requires significant assets on their books, such as a
steel producer, while AEG best applies to business models that
are best described from earnings, such as a talented human
capital oriented firm.
Recall that shareholder equity is assets minus
liabilities. If a
firm has mostly physical capital in its assets, ROE can be low.
On the other hand, a firm that generates the same
earnings but has mostly human capital will have a very high ROE.
This is an imperfection in how assets are measured, and
this makes a difference, as we now demonstrate.
Consider IBM. Item
1A of their 10-K clearly identifies their strategic shift over
the last decade:

STRATEGY
Despite the volatility of the information technology
(IT) industry over the past decade, IBM has consistently
delivered superior performance, with a steady track record
of sustained earnings per share growth. The company has
shifted its business mix, exiting commoditized segments
while increasing its presence in higher-value areas such as
services, software and integrated solutions. As part of this
shift, the company has acquired over 100 companies this past
decade, complementing and scaling its portfolio of products
and offerings.
Since they have exited commoditized segments to areas requiring
less physical capital, earnings are more informative than the
book value of assets in understanding IBM’s statements.
This comes up quite clearly when you compare estimates of
fundamental growth for IBM based upon ROE versus current analyst
forecasts. To see
this first select Fundamental Growth 2 Stage in the ROE form of
the dividend model:

The Valuation Tutor calculator immediately flags the issue:
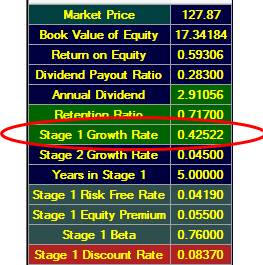
Fundamental growth when measured relative to the book value of
shareholder’s equity (42.5%) is much higher than current five
year analyst forecasts for IBM’s growth; the latter range
between 10% and -11%.
This is to be expected given that IBM’s business model
more heavily relies upon its human talent pool (which is not
measured in a traditional balance sheet) compared to real assets
that are measured by traditional accounting systems.
On the other hand, earnings reflects the
results from its human
talent pool.
This shift in business strategy also implies that IBM’s
sensitivity to the business cycle has increased which analysts
must consider when assessing the cost of equity capital.
The specific
learning objectives for this chapter are to understand:
·
What are Normal Earnings?
·
What are
Cumulative-Dividend Earnings?
·
What is Abnormal Earnings
Growth?
·
How do we estimate
Abnormal Earnings Growth?
·
What are the major inputs
into the Abnormal Earnings Growth Model?
·
How do we apply the
Abnormal Earnings Growth Model Using Valuation Tutor?
·
How to perform sensitivity
analysis on the key drivers to test their reasonableness?
·
What is the expected
return from a stock using the AEG model?
In the first
section we will first develop the new concepts introduced before
applying the AEG Model.
We start by defining what is meant by Normal Earnings and
then relate this concept to the idea of Abnormal Earnings
Growth.
As in the
residual income model, the accounting concept of income is
extended to account for opportunity costs.
In the last chapter we focused upon the balance sheet to
calculate opportunity costs in terms of the cost of equity
capital times the book value of shareholders’ equity net of
dividends paid to shareholders.
In this chapter we focus on the income statement and
calculate opportunity costs directly with respect to
comprehensive income (cum-dividends) and then adjust for the
opportunity costs associated with dividends paid to shareholders
Under clean surplus accounting and in a perfect market
world these two approaches are equivalent.
However, in a world with market imperfections arising
from aggregation issues, incomplete information and problems
associated with forecasting dynamic growth behavior these two
approaches will differ when implemented. As a result, judgment
must be used when choosing which valuation technique to apply
and this will depend upon assessing which statement is more
affected by these market imperfections as suggested by the IBM
example provided in the introduction.