
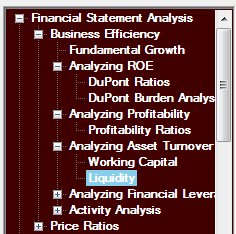
3.8 Liquidity
Ratios
Liquidity ratios can be
traced back to emergence of ratio analysis when banks started to
demand financial statements in the latter 19th
century. These
ratios are designed to provide an indicator of a firm’s ability
to repay its debts over the next twelve months.
As a result, they are computed from the current assets
and liabilities section of the balance sheet.
Recall, the previous topic introduced working capital
ratios. These ratios
let a user assess how efficiently a firm is transforming its
inventory into sales and how the firm is managing to collect its
receivables and pay its payables.
Liquidity ratios complement this working capital analysis
by extending this to the analysis to assess whether a firm can
meet its short run or current obligations.
A further distinction can
be made in the subsequent topic, between
liquidity and solvency.
Liquidity adopts a short run focus whereas solvency
adopts a longer term focus.
Solvency ratios assess whether a company is likely to be
able to repay their debts in the longer run and thus whether
they are a going concern.
In the next section on financial leverage we introduce
debt ratios that are relevant to assessing solvency.
The primary liquidity
ratios are the Current Ratio and its major liquidity refinements
the Quick and the Cash Ratios.
The Quick and Cash Ratios focus upon a firm’s ability to
immediately repay its obligations.
These are defined as follows:
Current Ratio =
Current Assets/Current Liabilities
Quick Ratio = (Cash
+ Marketable Securities + Accounts Receivable)/Current
Liabilities
Cash Ratio = (Cash
+ Marketable Securities)/Current Liabilities
A major property of the Quick Ratio is that Inventory is
excluded from Current Assets because this requires effort to
convert into cash plus it may only be quickly convertible at a
significant discount.
Similarly, for Accounts Receivable but the discount is
usually much smaller especially since the emergence of
securitization.
Securitization is the process of combining different company’s
accounts receivable and issuing securities against their cash
flows that are sold to investors.
Tutor Reconciliation:
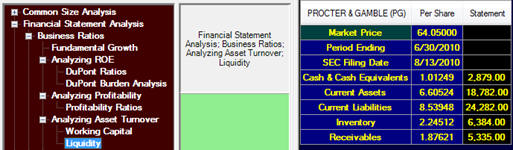
Proctor and Gamble (PG)
Our objective is to reconcile the following from the 10-K:
Step 1:
Bring up the Balance Sheet for Proctor and Gamble as
described in section 3.2.
For this example we will bring up two Balance Sheets
instead of both the Balance Sheet and Income Statement.
This is displayed at the bottom of the screen as follows:
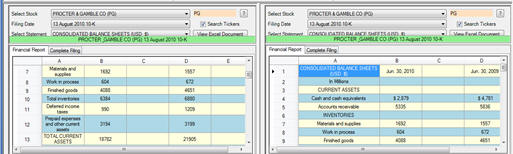
For Proctor and Gamble you can see the “Total Current Assets”
($18,782) as P&G describe it and Accounts Receivable are $5,335.
Similarly, total Inventories $6,384 and scrolling down reveals
the working capital items on the Balance Sheet.
Step 2:
Click on Calculate and we can verify the input and
derived fields for the following:
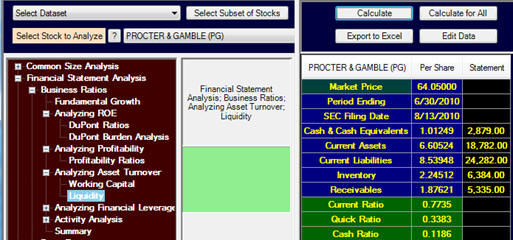
Current Ratio = 0.7735
Quick Ratio = 0.3383
Cash Ratio = 0.1186
In step 1 we extracted the relevant aggregate numbers from the
10-K and so the full reconciliation can now be traced through as
follows.