3.5 Extended DuPont
Analysis
The Extended DuPont
provides an additional decomposition of the Profit Margin Ratio
(Net Income/Sales) into two burden components, Tax and Interest,
times the Operating Profit Margin.
This is a positive refinement of the traditional DuPont
Analysis to provide a refinement of the profit margin ratio into
the operating profit margin ratio by taking out the effects
arising from taxes and interest expense.
As a result, it provides both management and the
financial analyst with finer information about a company and its
immediate competitors.
Formally, the Extended
DuPont formula is:
ROE = (Net
Income/EBT) * (EBT/EBIT) * (EBIT/Sales) * (Sales/Total
Assets) * (Total Assets/Shareholders’ Equity)
Each term in the
decomposition has a specific meaning:
Profit Margin Ratio
=Net Income/Sales now decomposes into:
Net Income/Earnings
Before Taxes = Tax Burden Ratio
Earnings Before
Taxes/Earnings Before Interest and Taxes = Interest Burden
Ratio
Earnings Before
Interest and Taxes/Sales = Operating Profit Margin
Asset Turnover
Ratio or Asset Use Efficiency = Sales/Total Assets
Financial Leverage
Ratio= Total Assets/Shareholders Equity
Net Income is measured
after taxes. So if
taxes are zero the tax burden equals one and so the lower this
number, the higher the tax burden.
Similarly, if Interest Expense is zero then interest
burden ratio equals one and therefore the higher the financial
leverage, the lower is this number.
The advantage of adjusting for taxes and interest is to
gain better insight into the firm’s profit margin by focusing
upon the operating profit margin.
Note that the product of
the first four terms is now ROA.
This is driven by operations, financing and the
management of taxes.
A nice property of the Extended DuPont formula is that one can
examine the breakdown of ROA from the perspective of major firm
decisions --- investment, financing and tax decisions.
The remainder of this
decomposition is as before.
That is, the fifth term is again related to the financing
decision; a highly leveraged firm has low Shareholders Equity
compared to Assets.
Tutor Reconciliation:
Proctor and Gamble (PG)
Practical Note:
Analysts vary in terms of how they apply the Extended DuPont
Analysis. The most
common practical variation from the above definitions is to use
the US GAAP definition of income from continuing operations.
The International Financial Reporting Standards (IFRS)
does not make the distinction between income from continuing
operations and so this practical note only applies to US GAAP.
The default numbers in Valuation Tutor screens have (CO) after
them to indicate that this is in relation to Continuing
Operations. The
reconciliation provided in this section will illustrate this for
Proctor and Gamble using continuing operations.
Users of Valuation Tutor can apply either definition to
the net income input field and if comparing across firms you
should apply the same convention.
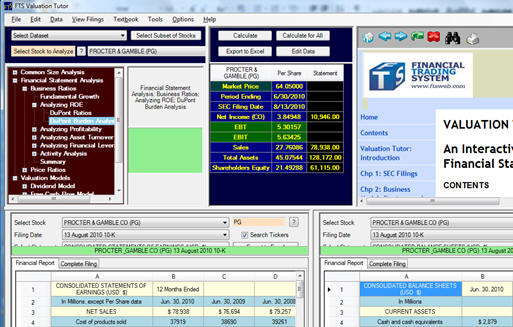
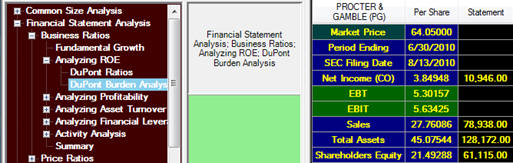
Step 1:
Bring up the Income Statement and Balance Sheet for
Proctor and Gamble as described in section 3.2.
This was displayed at the bottom of the screen as
follows:
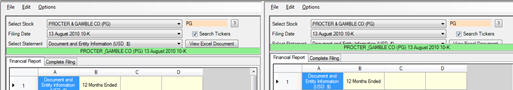
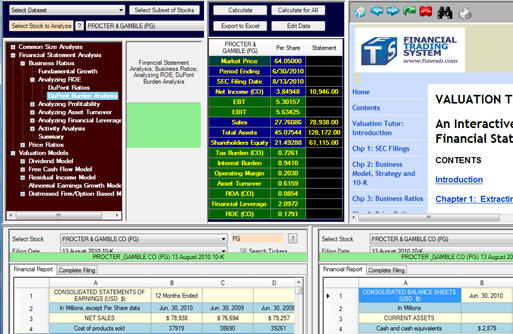
We can reconcile the Extended DuPont by selecting the
Consolidated Income Statement and Consolidated Balance Sheet as
follows:
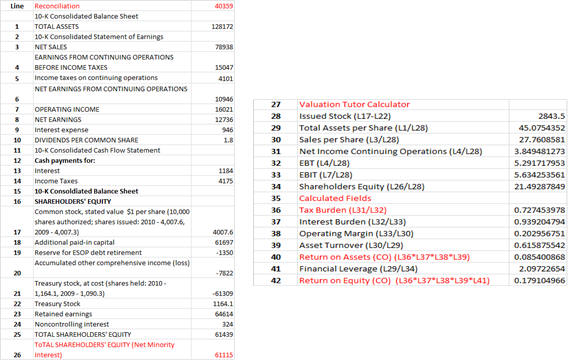
You can see from the above screen that the 10-K income statement
for Proctor and Gamble breaks out income from continuing
operations ($15,047) and taxes on income from continuing
operations ($4,101) from total income from continuing operations
after tax ($10,946) versus Proctor and Gamble’s Total Net Income
after Tax ($12,736) which was used in the previous topic 3.4.
Step 2:
Refer to the calculator part of the Valuation Tutor
screen. This has
computed the Extended DuPont from the following per share
fields:
Net Income (CO, Continuing Operations) = 3.756 per share
EBT (Earnings Before Taxes) = 5.3016 per share
EBIT (Earnings Before Interest and Taxes) = 5.6343 per share
Sales per Share = 27.7609 per share
Total Assets per Share = $45.0754 per share
Shareholders’ Equity = 21.4929 per share
Step 3:
Click on Calculate for the DuPont decomposition:
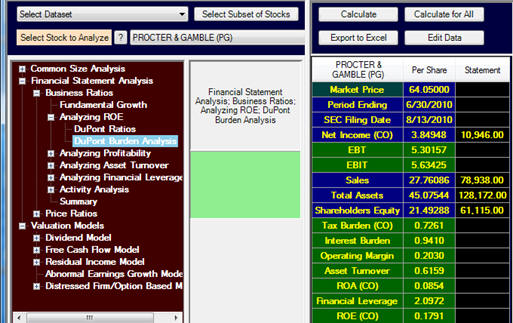
The additional derived fields are:
Tax Burden (CO) = 0.7261
Interest Burden = 0.9410
Operating Margin = 0.2030 or 20.3%
Asset Turnover = 0.6159
Return on Assets (CO) = 0.0854.
Financial Leverage Ratio =
2.0972
Return on Equity (ROE CO) = 0.1791
That is Proctor and Gamble’s Operating Margin is refined to
reveal the margin from continuing operations after adjusting for
Tax and Interest burdens.
Again in the next step we verify how these numbers have
been estimated from the financial statements.
Step 4:
Where did these numbers come from?
Each of the numbers can be traced back to two primary financial
statements:
The full reconciliation can now be traced through as follows: