Chapter 1: Introduction
Valuation Tutor
provides the visual and analytical tools to analyze the
financial statements and reports filed by publicly listed companies
in the US. The system is divided into three parts:
SEC Filings: Visual
Analysis of SEC Filings
Financial Ratios:
Visual Analytics
Intrinsic Value Models
Emphasis is placed upon working with current information,
relevant to today’s decisions, so that learning becomes fun
and useful. Ultimately
this motivates acquiring a deeper understanding valuation
which is important to both preparers and consumers of
financial reports. Valuation Tutor is designed to
reinforce this sequential approach to learning.
The next topic will develop this assertion further, however,
working with real world filings ensures that you acquire the
same
skills used by today’s management, financial analysts and preparers
of the corporate reports.
The
U.S. Bureau of Labor Statistics in their Occupational Outlook
Handbook (2010-11), forecasts that these skills are in strong
demand.
Valuation Tutor starts with the corporate filings (10-K, 20-F and
10-Q), including supporting sub statements, and focuses upon
extracting summary information from these filings to analyze a company and
its immediate competitors.
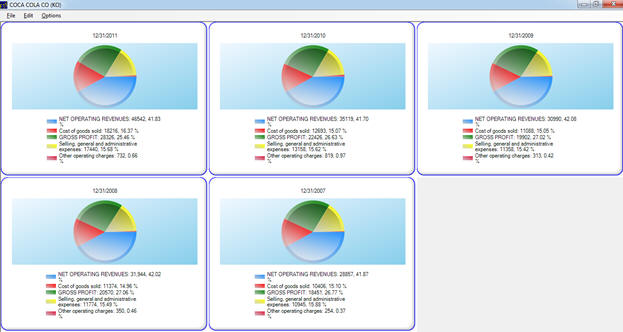
For example, consider the screen below:
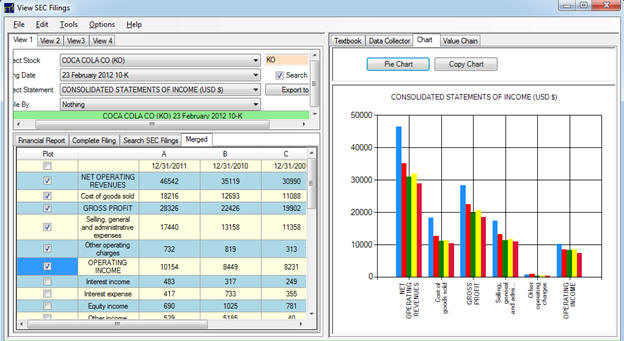
This provides a view of trends for Coca-Cola with respect to
their reported Gross Profit and Operating Income over time.
Pie chart analytics then permit the immediate depiction of
the same data to better understand the relative trends.
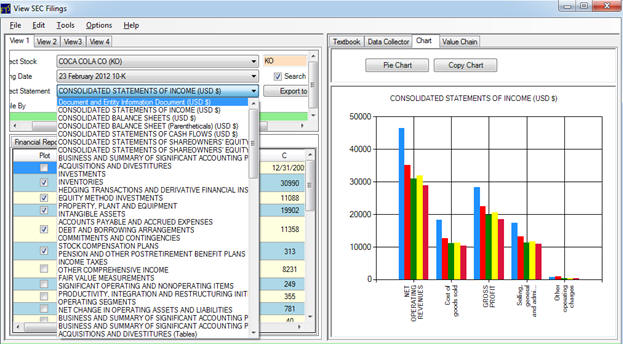
There are many details in a modern corporate report, and the
screen below depicts a small sample of these support statements in
Coca-Cola’s 10-K: