
A.5
Appendix:
Linkages Among the Financial Statements
Linkages among the financial statements arise from the
combination of accrual accounting with the underlying
economics associated with the firm’s business model.
Understanding these linkages generate predictable
patterns across the statements which in turn can provide
useful insights into future results.
Accrual accounting rests upon two basic principles:
Revenue recognition principle
Matching principle
The revenue recognition principle is that revenues are
reported on the accounting income statement in the period
they are earned and not the period when the contract is
created or the period when cash is collected.
This is an essential part of accrual accounting that
immediately can gives rise to both a current and non-current
balance sheet item usually referred to as “Unearned
Revenues” and an asset referred to as “Accounts Receivable.”
We refer to this as the
revenue cycle.
Similarly, the matching principle is that expenses are
reported on the accounting income statement in the period
they are associated with recognized revenues or the period
in which they were incurred if no direct association with
revenue can be made such as marketing expenses.
Combined the
matching principle results in what we will refer to as the
revenue and expense
cycle.
Understanding the revenue and expense cycle will generate
predictable patterns across the statements and understanding
these patterns can be most useful for predicting future
income as well as assessing the quality of current earnings.
In turn, these patterns provide rich insight into how a
company applies these two principles.
We will illustrate this for the case of 1-800 Flowers
using both Valuation Tutor’s SEC Filings:
A Visual Analysis and Common size Analysis.
The Revenue and Expense Cycle
Consider first the accounting transactions that arise from
booking earned and unearned revenues:
Dr Cash
Dr Accounts Receivable
Cr Revenue (this passes US GAAP’s revenue
recognition tests that the process for earning revenue
is complete)
Cr Current Unearned Revenue (process for earning
revenue is expected to be complete within a year)
Cr Non-Current Unearned Revenue (process for
earning revenue is expected to be complete beyond one
year)
Observe cash can be collected even though revenue is not
earned in an accrual accounting sense.
When the current unearned revenue is earned or the
non-current unearned revenue becomes current then the
process continues with:
Dr Current Unearned Revenues
Cr Sales
Dr Non-Current Unearned Revenue (If process for
completing revenue shifts to being within one year)
Cr Current Unearned Revenue
Under accrual accounting the revenue cycle is completed once
unearned revenue has been earned.
Under cash accounting the revenue cycle is completed
once the cash is collected.
On the cost side the merchant model of accounting (e.g.,
selling inventory) books gross revenue and subtracts away
Cost of Goods Sold or for a service provider subtracts away
cost of sales.
That is, a service related firms report “cost of revenues”
separately from “operating costs” when the costs are
directly associated with revenue as required by the matching
principle. That
is, the cost of revenue side are the costs that directly
support completing the revenue cycle.
Dr Inventory (or Pre-payments if a service firm)
Cr Accounts Payable
Cr Cash
Dr COGS (or Cost of Sales)
Cr Inventory (or Pre-payments)
Dr Marketing and Selling Expenses (Associated with the
current revenue cycle)
Dr Marketing and Selling Prepayments (Associated with
future revenue cycle)
Cr Accounts Payable
Cr Cash
Financial analysts look for confirming activity in
associated accounts to test credibility of growth.
In the above observe that “pre-payment activity” for
a tech stock may serve the same role as inventory for a
retailer or manufacturing stock.
If the stock’s business model is an “agent model” (i.e.,
earning agents or booking fees) then revenue must be
reported as net revenue.
That is, gross revenue less the amount rebated to the
party the firm is acting on behalf of.
Example 1:
1-800 Flowers Income Statement
Revenue and Cost Cycle for 1-800 Flowers
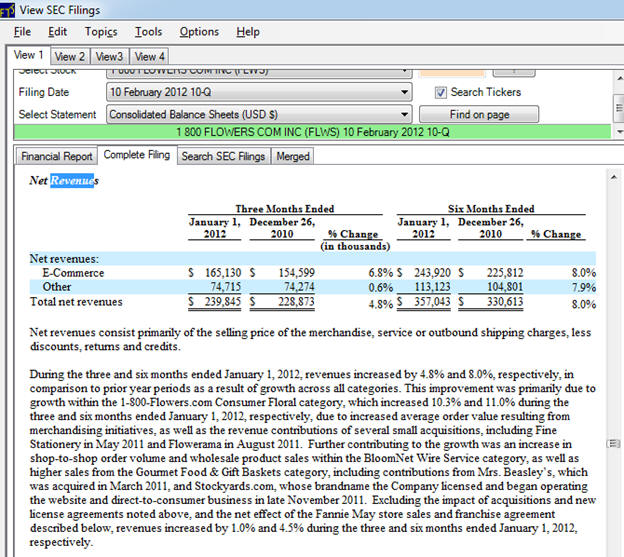
This stock does not have any unearned revenues. And
increased revenues by 4.8% for the December quarter however
much of this was due to growth via new acquisitions as
described above.
The increase in web business is likely to explain the
reduction in accounts receivable (and thus increase in cash
sales) when compared to the same three months a year ago.
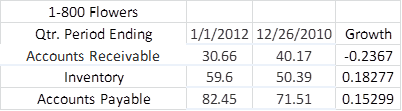
However, both inventory and accounts payable have
increased significantly more than sales.
These are flags and in future topics you will learn
how to analyze this at a deeper level by analyzing the
working capital management trends for 1-800 Flowers.
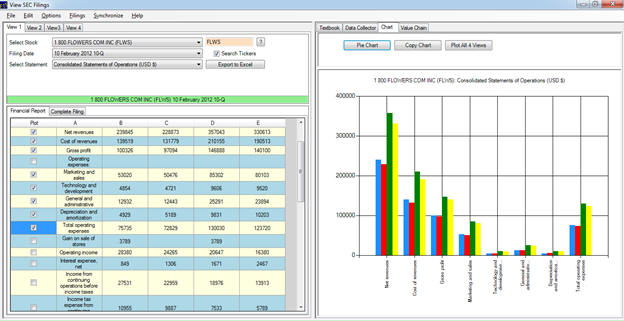
Additional cost behavior analysis related to revenue growth
are the operating cost categories:
Observe in the RHS of the graph that Operating income for
the latest three months is higher than for the latest six
months and similarly for 1-year ago.
Focusing on the LHS of the screen the elements of
cost of sales and operating expenses are provided as
follows:
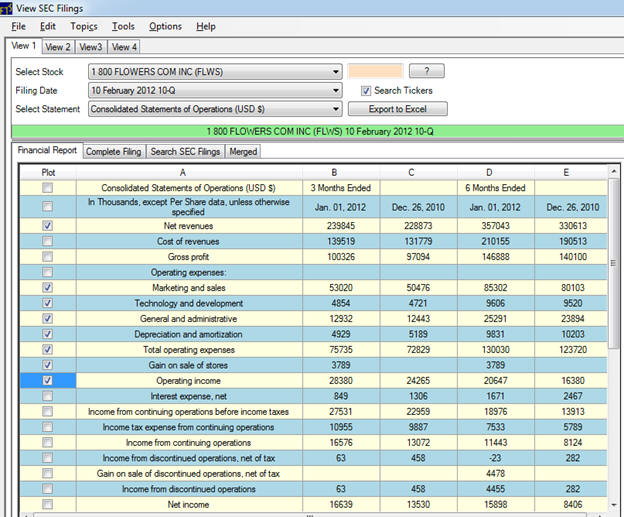
First, observe that the 6-months gross profit is larger than
the 3-months gross profit for both years but this reverses
at the operating profit level for both years.
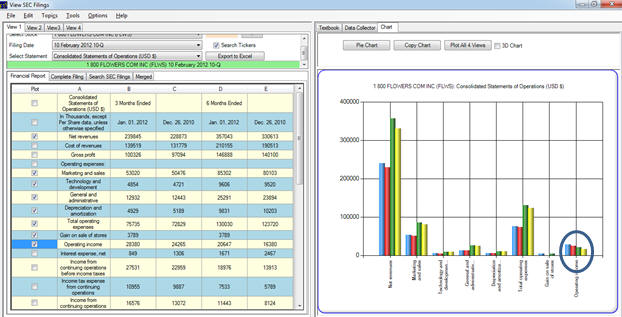
To explore what is going on we will draw from a
higher level of Valuation Tutor which provides common size
analysis:

Click on the second button above:
Question: Why
are the 3-month net operating incomes higher for
1-800-Flowers than the 6-month operating incomes and what is
driving this?
Answering this question requires a common value analysis.
The following screen looks at these quarterly
statements dividing each one by its respective net sales
revenue. A lot
is going on in the following screen so we will consider the
components sequentially:
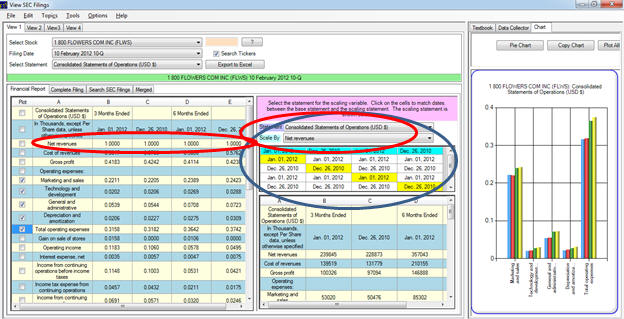
The middle part of the screen is the control center.
1-800 Flowers quarterly income statement reports
3-months and 6-months for current and a year ago.
The top middle screen provides the statement dates
and so to divide each statement by its respective net sales
select the dates for each statement as indicated in yellow
(highlighted cells) larger circle above.
The smaller circle indicates what the scaling
variable is, which in this case is Net Sales from the
Consolidated Statement of Operations.
The effect of this is observed in the LHS of the screen such
that each statement is now provided in common size form
scaled by their respective net revenues.
See the net revenue line is 1.000 for each financial
report as circled in the LHS.
The net effect now is to rescale the raw statements provided
in the bottom center of the screen to % of Sales provided in
the LHS and which can be graphed in the RHS.
This lets us proceed to answer the question.
Question:
Why are the 3-month net operating incomes higher for
1-800-Flowers than the 6-month operating incomes and what is
driving this?
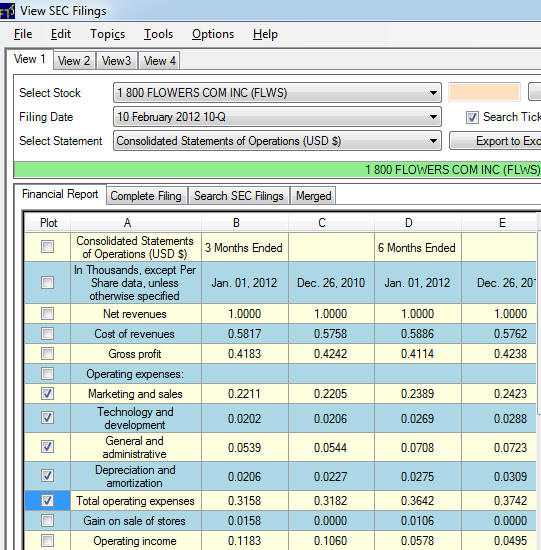
First, observe that the % of cost of sales are relatively
unchanged and between the years.
As a result, because 6-month sales are greater than
3-month sales then 6-month gross margins are higher in total
dollar terms.
This does not carry down to the total operating costs.
The 6-month costs are 36 and 37% respectively for
2011 and 2010 whereas this drops to 32% for the 3-month
figures. Each
of the operating cost categories are higher for the 6-month
period than they are the for 3-month periods even though the
business is highly seasonal (sales are larger at year end).
The common size chart immediately reveals this:
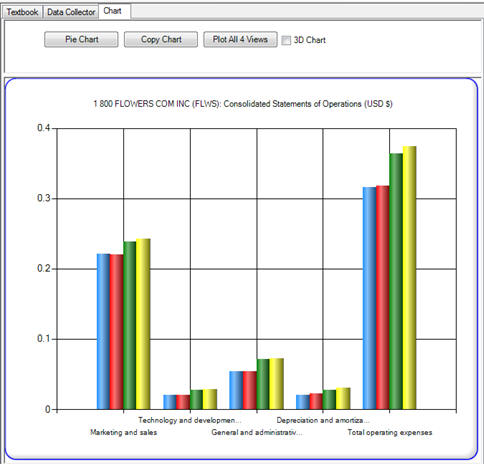
In the above each group of four has the two 3-month % of
sales on the left side and the two 6-month % of sales on the
right side of the four vertical bars.
This leads to the cumulative effect in the LHS plot
(Total operating expenses).
Under the matching principle these are largely period
expenses and thus this reflects that 1-800-flowers allocate
significantly more expenses to their final quarter of their
financial year (ending July 3, 2011) than they do to their
first quarter.
Getting to these timing issues is just one example of the
advantage for conducting common size analysis of financial
statements. In
Valuation Tutor many other advantages are developed
especially when moving into ratio analysis.
Summary:
Answer to the question is that 1-800 Flowers recognizes more
operating expenses in its final quarter (i.e., 10-K report)
than it does in earlier quarter (10-Q reports).
This example, provides interesting insight into how
the matching principle is applied by at least this company.
The Accounting Equation and Linkages Across the Major
Statements
Mathematically the four major financial statements are
linked via the beginning and end of period fundamental
accounting identity, Assets equal Liabilities and Owner’s
Equity. The
income statement and the statement of stockholders’ equity
provide the linkage between the two balance sheets.
These reports are based upon two temporary accounts
that get closed off to the stockholders’ equity section of
the balance sheet every period.
The accounting income summary account is closed off
to (accumulated) “Retained Earnings” and the Other
comprehensive income account (i.e., Consolidated Statement
of Stockholders’ Equity ) is closed off to “Accumulated
Other Comprehensive Income.”
Finally, the Consolidated Cash Flow Statement merely
provides a reconciliation of the opening and closing
balances of Cash and Marketable Securities.
In other words, the underlying driver is the
Consolidated Statement of Financial Position which reflects
at a point in time the basic accounting equation:
Total Assets = Total Liabilities + Owners’ Equity
Example:
Proctor and Gamble
It is one thing to describe the conceptual framework that
underlies modern financial statements.
It is another thing to be able to classify the set of
linkages among actual real world financial statements.
In the next section we consider the set of statements
filed by Proctor and Gamble (P&G) and their linkages.
For the case of a cash flow statement you will quickly
discover that classifications by activity are never
completely clean when working with the real world
statements.
This is because aggregations within the statement will vary
from company to company and cut across category
classifications.
P&G has been selected because it provides a nice
example of reporting combined with an introduction to real
world issues that arise.
Online by working with the Valuation Tutor software in
conjunction with the actual filed statements is that you can
quickly compare across a range of companies to see how
different companies have dealt with aggregation issues with
respect to their external financial statements.
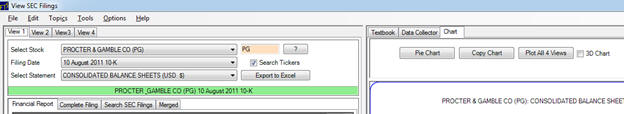
This type of insight can be gained by working with
the 10-K Viewer in conjunction with the four Views as
depicted below.
For example, View 1 being Consolidated Balance Sheet, View 2
the Consolidated Income Statement and so on.
Furthermore, the plot All 4 Views allows for visual
across statement analyses to be performed.
When analyzing the linkages across statements it is useful
to further relate these linkages to the nature of activities
that directly affect the accounts.
In particular,
Operating Activities
Investing Activities
Financing Activities
Dividend Activities
Linkages Among P&G’s Statements
We can color code the balance sheet items to reveal at a
glance whether the major driver of these accounts result
from operating activities (lightest green), investing
activities (darker green) and financing activities
(in-between lighter and darker green).
Classifying these activities in this way is described
in the topic titled:
A Quick Tour of the Balance Sheet.
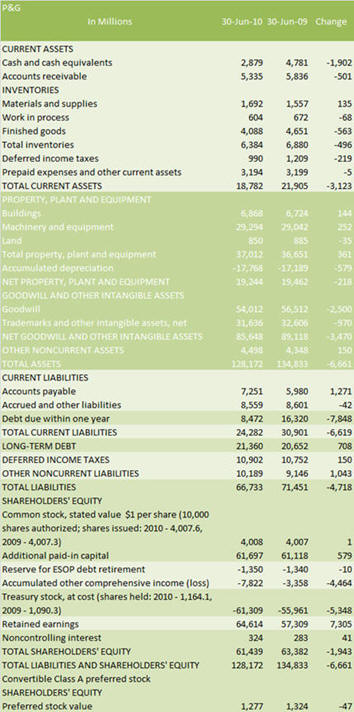
The above color coded statement the basic set of categories
are described in the topic
“A Quick Tour of the Balance Sheet.”
In later chapters you will learn how to extract even
finer information from these linkages using business ratio
analysis and activity analysis.
Working line by line we have the following items:
Current Assets
Cash and Marketable Securities (Category:
Operating)
Accounts Receivable (Category:
Operating)
Inventory (Category:
Operating)
Prepaid Expenses (Category:
Operating)
Deferred Taxes (Category:
Operating)
Non-Current Assets
Property, Plant and Equipment (Category:
Investing)
Leases (Category:
Investing)
Deferred Taxes (Category:
Operating)
Pension Fund (Category:
Investing)
Long-Term Investments
(Category:
Investing)
Intangible Assets (Category:
Investing)
Liabilities
Current Liabilities
Accounts Payable (Category:
Operating)
Notes Payable (Category:
Operating and Financing)
Current Maturities of Long-Term Debt (Category:
Financing)
Accrued Liabilities (Category:
Operating)
Unearned Revenue or Deferred Credits (Category:
Operating)
Deferred Income Taxes (Category:
Operating)
Non-Current Liabilities
Long Term Debt (Category:
Financing)
Capital Lease Obligations (Category:
Financing)
Postretirement Benefits Other Than Pensions (PRB) (Category:
Investing)
Commitments and Contingencies (Category:
Operating)
Non Controlling Interests (Category:
Financing)
Stockholders’ Equity
Common Stock (Category:
Financing)
Additional Paid-In Capital (Category:
Financing)
Retained Earnings (Category:
Operating)
Accumulated Other Comprehensive Income (Category:
Operating)
Other Equity Accounts (Category:
Financing)
Linkages Among the Financial Statements:
The Consolidated Income Statement
The Income Statement largely reflects the result of a firm’s
operating activities.
In addition, part of the financing decision, interest
on debt financing, is also reflected in the income
statement.
Investing activities also affect the income statement via
depreciation and amortizations but often this is aggregated
with other line items as is the case for Proctor and Gamble
below. However,
these items are itemized in the Statement of Consolidated
Cash Flows considered in the next topic.

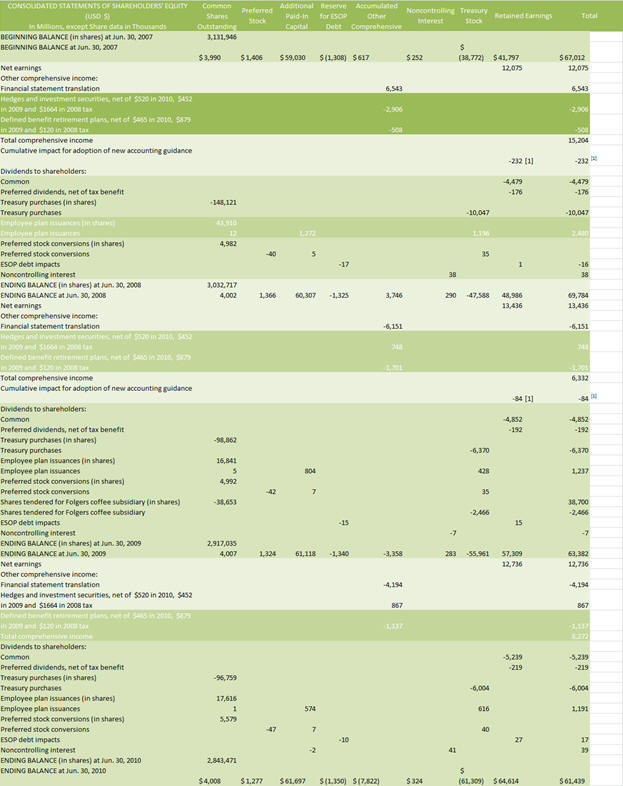
Linkages Among the Financial Statements:
The Consolidated Statement of Stockholder’s Equity
There are four major categories highlighted in the Statement
of shareholders’ Equity which can be classified in terms of
their usual major drivers are as indicated:
Foreign Currency Translations (Operating activities)
Unrealized Gains and Losses (Operating, Investing and
Financing Activities)
Retirement Related Benefit Plans (Investing activities)
Hedge Accounting Adjustments (Operating and Financing
Activities)
The hedge accounting adjustments can arise from hedging both
operating risks (e.g., commodity price increases) as well as
financing risks (e.g., creating synthetic fixed rate loans
using interest rate swaps).
Similarly, unrealized gains and losses can arise from
operating activities (lower of cost or market), investing
activities (gains and losses arising from fair value
accounting for investments), and similarly for financing
activities.
The retirement related benefit plans can be interpreted as
related to human capital, an important component of a firm’s
capacity to produce products and services.
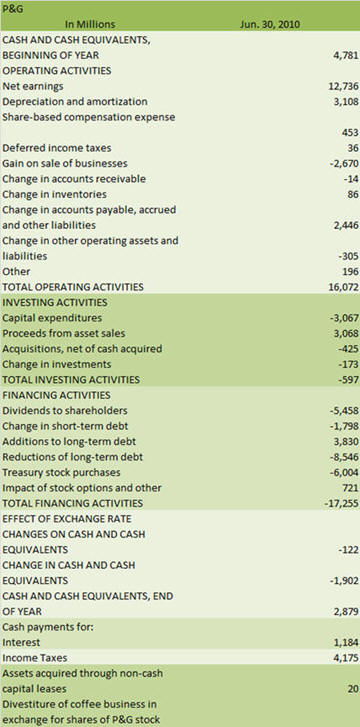
Linkages Among the Financial Statements:
The Consolidated Cash Flow Statement
This is the Statement that draws together the other
statements. It is organized around the business activities
of a firm so the color highlighting below is fairly
transparent.
There is one note to point out.
US GAAP mixes some financing activities into the
operating activities section.
This is due to how US GAAP treats interest expense.
In the P&G example below, observe that the Cash Flow
Statement in the indirect form starts with Net Income after
tax and adds back Depreciation and amortization, the
non-cash expenses.
It then adjusts for changes in working capital and so
on. However,
there is no adjustment for interest expense in the cash flow
from operations and so implicitly this ends up in the
operating activity section of the Cash Flow Statement.
This is not the case for dividends of course.
By the end of this topic you should have a reasonable
working knowledge of the inter-relationships across the
different financial statements.
You are encouraged to repeat this same exercise for a
small sample of firms.
This will let you compare notes to see how different
firm’s treat accounting aggregation differently.