
1.4 Understanding the Firm and Financial
Statement Analysis
Financial statement analysis is a set of techniques to analyze
the financial performance of a company, to assess its strengths
and weaknesses, and to compare it to other firms in the same
industry. It
provides information about the past and current performance of a
company. It is also
used to project the future performance of a company.
It is used by the company’s managers to improve
performance, by analysts who provide recommendations on the
company’s stock, by the company’s creditors who decide whether
to lend money to the company, and by the shareholders of the
company who are interested in the current performance of the
company and in whether the company will continue to be
profitable. A
necessary condition for successful financial statement analysis
by an financial analyst is to first understand the business.
In the “Conceptual and Practical Skills” topic below we
illustrate step-by-step what is really required to understand
the business. Item 1
in the 10-K is an invaluable source of information for this
purpose. This is
because in this item the firm gets to describe their business
model and strategy.
In this section we work through the operational steps required
for unlocking this information from a 10-K.
In turn this information provides a framework for
interpreting the results from a financial statement analysis.
Financial statement analysis uses the uses the financial reports
of a company as its main input.
The Financial Accounting Standards Board (FASB) describes
the objective of financial reporting as follows:
“…… to provide financial information about the reporting entity
that is useful to present and potential equity investors,
lenders, and other creditors in making decisions in their
capacity as capital providers.
Capital providers are the primary users of financial
reporting. To
accomplish the objective, financial reports should communicate
information about an entity’s economic resources, claims to
those resources, and the transactions and other events and
circumstances that change them. The degree to which that
financial information is useful will depend on its qualitative
characteristics.”
The International Accounting Standards Board (IASB) adopts a
similar, but slightly different, approach:
“…to provide financial information about the reporting entity
that is useful in making decisions about providing resources to
the entity and in assessing whether the management and the
governing board of that entity have made efficient and effective
use of the resources provided. The reporting entity concept is
intended to further this objective.”
Conceptual and Practical Skills
Valuation Tutor works directly with company filings. This
includes gaining an understanding the language, the aggregations
and the classifications actually used by public firms when
presenting their accounts.
For example, Valuation Tutor lets you quickly compare the
current major annual and/or quarterly financial statements filed
by some subset of companies that you specify from the SEC’s
interactive data.
In terms of developing your conceptual skills in relation to
these filings we take the perspective of investors, and so our
focus in on understanding how publicly traded companies create
value for shareholders.
An essential tool in understanding how a company creates
value is financial statement analysis, which involves studying
the financial reports of a company and learning how to extract
information from financial reports.
We start with some basics.
A company is owned by its shareholders.
In return for investing in the company, the shareholders
expect a return.
This return can come in the form of dividends, stock
repurchases, or capital gains.
The higher the return, the greater the value created by
the company.
A quote attributed to Warren Buffet asserts:
“Never invest in a business that you do not understand.”
Today this quote is in danger of becoming a cliché, however if
you apply the conceptual framework in figure 1, you will gain
insight into the quote’s intended original meaning.
That is, understanding a business starts with
understanding a firm’s business model and then learning how to
identify and evaluate a firm’s business strategy.
Figure 1 summarizes this process and includes two
important tools designed to help you achieve this objective by
helping you to gain insight into how business strategy is
formulated, communicated and evaluated.
These tools are “SWOT” and “Balanced Scorecard” analyses.
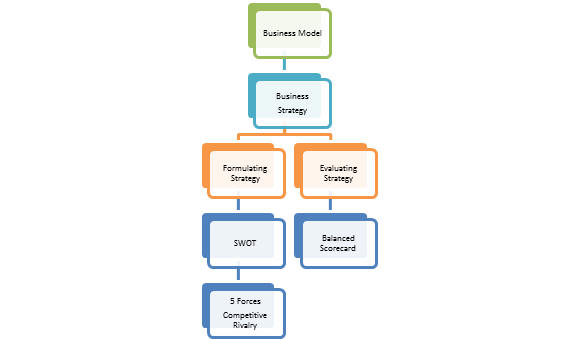
Figure 1:
Understanding the
Business
Overview of Understanding the Business
First, the business model describes how the company builds
shareholder value.
In order to become better acquainted with the business model we
will represent in terms of Porter’s Value Chain which depicts
the set of primary value adding activities required by the
model. Second, a
firm’s business strategy, which describes how a firm implements
it’s business model, can also be understood relative to the
firm’s value chain.
In this case the business strategy identifies which value adding
activities are emphasized relative to others.
This may imply that some of these activities are
outsourced or even eliminated relative to competitive rivals.
Identifying and understanding a firm’s business strategy from an
analyst’s perspective, is not easy.
In the following sections we approach this problem by
providing a set of operational steps that if followed, provide
rich insights into identifying and understanding a business from
this perspective.
First, it is useful to perform a “SWOT” analysis.
That is, an analysis of the
Strengths and
Weaknesses which are
internal to a firm, and an analysis of the
Opportunities and
Threats that are
external to the firm.
The external analysis requires an assessment of the
degree of competitive rivalry faced by the firm.
A SWOT analysis is a key component for formulating
strategy because it forces management to consider both the
internal and external environments that the firm’s business
model is implemented in.
Just as SWOT is useful for
identifying and
formulating a firm’s business strategy, a Balanced Scorecard
analysis is a useful tool for
communicating and
evaluating a firm’s business strategy.
We now illustrate these important steps that need to be
taken in order to understand a business.
Step 1: The
Business Model
The first step is to understand what a company does
to create shareholder
value. This is
called the business model.
For example, a company could decide to produce cars,
computer chips, or operate retail stores.
This information is disclosed in the company’s annual
report; and in the United States a publicly traded company must
file such a report with the Securities Exchange Commission
(SEC). The SEC’s
website summarizes the filing requirements as follows:
“The federal securities laws require publicly traded companies
to disclose information on an ongoing basis. For example,
domestic issuers (other than small business issuers) must submit
annual reports on Form 10-K, quarterly reports on Form 10-Q, and
current reports on Form 8-K for a number of specified events and
must comply with a variety of other disclosure requirements.
The annual report on Form 10-K provides a comprehensive overview
of the company's business and financial condition and includes
audited financial statements.”
(http://www.sec.gov/answers/form10k.htm)
Here are three examples that cover retailing, manufacturing and
services, taken from 2010 10-K filings:
•
“Wal-Mart Stores, Inc. (“Walmart,” the “company” or “we”)
operates retail stores in various formats around the world and
is committed to saving people money so they can live better.”
•
Intel Corporation:
“We develop advanced integrated digital technology, primarily
integrated circuits, for industries such as computing and
communications. Integrated circuits are semiconductor chips
etched with interconnected electronic switches. We also develop
computing platforms, which we define as integrated hardware and
software computing technologies that are designed to provide an
optimized solution.”
•
IBM Corporation: :
“The company creates business value for clients and
solves business problems through integrated solutions that
leverage information technology and deep knowledge of business
processes. IBM solutions typically create value by reducing a
client's operational costs or by enabling new capabilities that
generate revenue. These solutions draw from an industry leading
portfolio of consulting, delivery and implementation services,
enterprise software, systems and financing. “
You can see that each of these companies state quite precisely
what they do; one operates retail stores, Intel produces
computer chips (integrated circuits) and computing platforms and
IBM provides innovative solutions that exploit cutting edge
technology to their clients.
Representing the Business Model as a Value Chain
An important concept, due to Porter (1985), is called the value
chain which is defined from the firm’s business model.
This tells you the sequence of activities the company
performs so you can see what the firm does; this lets you see
where it is weak and where it is strong.
For example, think of a bookseller.
Given their assets (e.g., the store), the activities will
consist of buying books from publishers (procurement), internal
operations (receiving the books, putting them on the shelves,
paying bills), marketing and sales (advertising, store displays,
helping people find books), and customer service (special
orders, returns). The
activities help you decide what to look for when identifying
their business strategy and evaluating their performance.
In this example, some the important business ratios are
fairly evident: return on assets is a broad measure of
profitability, and clearly you would be interested in the
average number of days it takes for inventory to turnover.
In Porter’s original formulation a typical chain was depicted as
follows:
Since Porter’s original formulation of the Value Chain in 1985,
there have been many technological innovations including the
emergence of real time databases that have had a profound impact
upon value chains.
As a result, information flows drive today’s value chains and
technology is applied to squeeze out efficiencies that were not
available in 1985. For
example the rise of Supply Chain Management (SCM) and Customer
Relationship Management (CRM) techniques, that exploit real time
access to information throughout the entire chain, make the
entire chain very dynamic.
This has led to some activities initially classified by
Porter as support activities, becoming primary activities for
some businesses.
For example, in SCM procurement is a primary activity.
Similarly, it has also led to the chain truly becoming a
“chain.” For
example, CRM is designed to maintain ongoing relationships with
clients so the links form into a chain.
We now consider two examples illustrating these points.
Earlier part of the Item 1 10-K descriptions were provided for
IBM and Wal-Mart.
Consider, Wal-Mart first.
Porter’s generic description is applicable with the
following modifications:
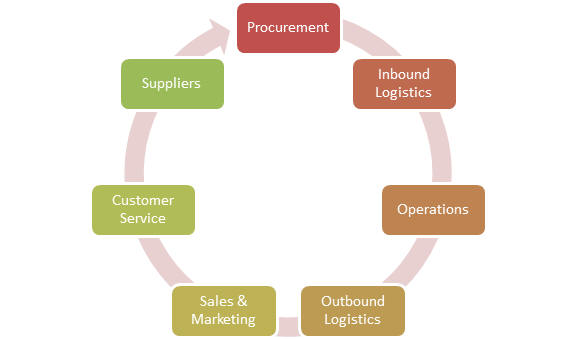
Figure 2, A Value Chain for Wal-Mart
Supply chain management is critical to Wal-Mart and as such
there is an extended relationship with Suppliers that is linked
via databases.
Similarly, the Procurement activity is key to Wal-Mart for
supporting everyday low pricing.
This is reinforced in Wal-Mart’s 10-K when describing
their executive officer titles (Item 4):
“Executive Vice President, Chief Information Officer. From
February 2003 to April 2006, he served as Executive Vice
President, Logistics and Supply Chain.”
On the other hand Customer Relationship Management is important
to IBM and their value chain will look very different to
Wal-Mart. For
example procurement is not an important activity to IBM.
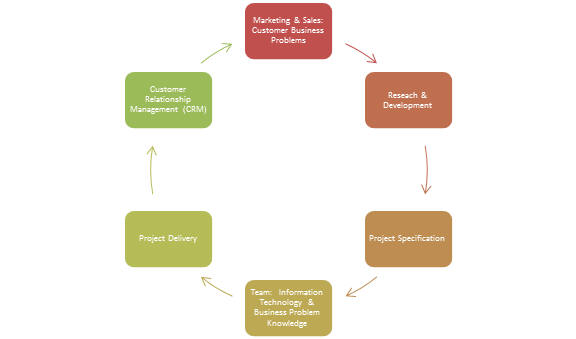
Figure 3: A Value
Chain for IBM
Becoming acquainted with the company’s Business Model at the
above level is an important necessary step that facilitates
identifying and understanding a company’s business strategy.
The best starting place for becoming acquainted with a
firm’s business model and business strategy is the firm’s 10-K,
and Valuation Tutor makes this immediately available to you by
entering the stock ticker.
Once you are able to represent a firm’s business model in terms
of a value chain you are now in a position to become acquainted
with the firm’s business strategy.
Step 2: Business
Strategy
The second step is the business strategy.
This summarizes how the company intends to implement its
business model to create shareholder value.
One way you can think of the difference between the
business model and the business strategy is that the model is
what it wants to do to create shareholder value and the strategy
is how it plans to do it.
An important part of the strategy is how it plans to
compete with other companies and as such, the degree of
competitive rivalry a firm faces is the major driver of the
design of a firm’s business strategy.
For example, business strategy is not important to a gold
miner whereas it is most important to a Wal-Mart, Intel or an
IBM as again the 10-K report reinforces.
For our three examples Item 1 contains the following:
• Wal-Mart: “We earn the trust of our customers every day by
providing a broad assortment of quality merchandise and services
at everyday low prices (“EDLP”) while fostering a culture that
rewards and embraces mutual respect, integrity and diversity.
EDLP is our pricing philosophy under which we price items at a
low price every day so our customers trust that our prices will
not change under frequent promotional activity”
• Intel Corporation: “We design and manufacture computing and
communications components, such as microprocessors, chipsets,
motherboards, and wireless and wired connectivity products. Our
platforms incorporate software to enable and advance these
components. We strive to optimize the overall performance of our
products by improving energy efficiency, seamless connectivity
to the Internet, and security features. Improved energy
efficiency is achieved by lowering power consumption in relation
to performance capabilities, and may result in longer battery
life, reduced system heat output, power savings, and lower total
cost of ownership. Increased performance can include faster
processing performance and other improved capabilities, such as
multithreading, multitasking, and processor graphics.
Performance can also be improved by enhancing interoperability
among devices, storage, manageability, utilization, reliability,
and ease of use.”
For the case of IBM they explicitly discuss strategy in Item 1
of their 10-K, under the heading Strategy:
IBM Corporation:
STRATEGY
“ Despite the volatility of the information technology
(IT) industry over the past decade, IBM has consistently
delivered superior performance, with a steady track record of
sustained earnings per share growth. The company has shifted its
business mix, exiting commoditized segments while increasing its
presence in higher-value areas such as services, software and
integrated solutions. As part of this shift, the company has
acquired over 100 companies this past decade, complementing and
scaling its portfolio of products and offerings.
IBM's clear strategy has enabled steady results in core
business areas, while expanding its offerings and addressable
markets. The key tenets of this strategy are:
• Deliver value to enterprise clients through integrated
business and IT innovation
• Build/expand strong positions in growth initiatives
• Shift the business mix to higher-value software and services
• Become the premier globally integrated enterprise
These priorities reflect a broad shift in client
spending away from "point products" and toward integrated
solutions, as companies seek higher levels of business value
from their IT investments. IBM has been able to deliver this
enhanced client value thanks to its industry expertise,
understanding of clients' businesses and the breadth and depth
of the company's capabilities.
IBM's growth initiatives, like its strengthened
capabilities, align with these client priorities. These
initiatives include Smarter Planet and Industry Frameworks,
Growth Markets, Business Analytics and Cloud Computing. Each
initiative represents a significant growth opportunity with
attractive profit margins for IBM. “
Again, the three strategy descriptions illustrated above for
Wal-Mart, Intel and IBM, are fairly simple: one strives for
consistently low prices, one strives to improve performance, and
the third innovates and transforms these innovations into
providing solutions for their clients.
It is clear that if each of these entities perform these
tasks well and better than their competitors, they will build
shareholder value.
Business Strategy and the Value Chain
Observe in the previous topic on Business Model that the set of
major value adding activities are identified, but there was no
attempt to identify what relative weighting was placed on each
of the activities.
For example, consider the following value chain that is equally
applicable to two competitive rivals, Coca Cola and PepsiCo:
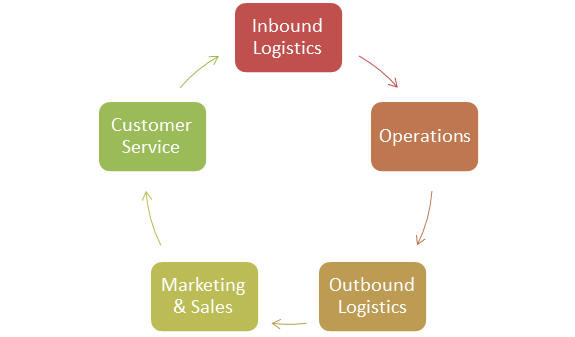
Figure 4: Value
Chain for Coca Cola and PepsiCo.
From a business strategy perspective prior to the fourth quarter
of 2010 these two companies placed very different weights on
these activities.
Coca Cola outsourced Outbound Logistics whereas Pepsico retained
outbound logistics.
This difference abruptly changed when Coca Cola announced on
February 25, 2010 that it had agreed to acquire the North
American bottling plants.
From the perspective of the above chain this placed
weight upon
Outgoing Logistics plus it also placed increased weight upon
Sales and Marketing because now Coca Cola had much quicker
access to local information and flexibility to match regional
promotions run by PepsiCo in local supermarkets and other
outlets.
From an operational perspective, Business Strategy can be
defined directly in terms of the activities on a value chain.
In particular,
strategies tend to fall within one of three types.
A firm may choose to perform:
i.
Different activities to their rivals
ii.
The same activity in different ways
iii.
Choose not to perform an activity
For the case of our Coca Cola and PepsiCo example, prior to 2010
they competed in terms of iii. but this placed Coca Cola at a
disadvantage to PepsiCo in terms of their marketing and sales.
That is, they lacked the flexibility and the real time
information provided from controlling the bottling and
distribution operations at a regional sales and promotions
level. Post the
acquisition, the competitive strategy intensified with respect
to Marketing and Sales activity ponce Coca Cola has control over
these elements of the value chain..
Similarly, for the case of i, above, Amazon and Wal-Mart are
competitive rivals but Amazon places total emphasis on the world
wide web and cloud computing whereas Wal-Mart places their major
emphasis on “bricks and mortar.”
For the case of ii, Wal-Mart and Target are competitive rivals
and both emphasize “bricks and mortar.”
However, these two entities perform the same activities
in different ways.
Wal-Mart emphasize every day low pricing and Target emphasize
shopping experience.
Finally, we have already seen that IBM has shifted away from
producing from highly commoditized products (e.g., PC’s) towards
providing innovation solutions to their clients consistent with
their advertising theme of “making the world work better.”
That is, they chose not to perform certain activities in
their current business strategy.
The above examples, are designed to illustrate how the value
chain lets you represent both the business model and the
business strategy of a firm.
For the case of the former all major value adding
activities are required and identified.
For the case of the latter the relative importance of the
links must be identified.
Once you are familiar with the firm at this level then
you are able to interpret the results from financial statement
analysis in a much more meaningful way.
But first, there are two other important dimensions to business
strategy as indicated in Figure 1.
These are formulating strategy and evaluating strategy.
Formulating Business Strategy and SWOT Analysis
A strategy cannot be formed in a vacuum, and its effectiveness
will depend on various factors, both internal to the firm and
external to the firm.
One way to think about these factors goes by the acronym
SWOT: “Strengths,
Weaknesses, Opportunities and Threats.”
Remember that a financial statement only reflects what
happened in the past and thus by the time a competitive threat
facing a company actually starts affecting the financial
statement, it may be too late.
For example, historically IBM was a major driver of the
development and marketing of typewriters.
In 1933 Thomas J. Watson, Sr., IBM's founder and first
president, purchased the production facilities, tools and
patents of a small early producer of typewriters, a company
named Electromatic. IBM was only 20-years old at the time and it
put its development, production and marketing know-how into
perfecting an electric typewriter.
This ended up revolutionizing the typewriter industry.
Over time technology and the competitive rivalry changed and
this resulted in IBM selling it’s typewriter division in 1990 to
Lexmark whilst it still had some value.
The importance of SWOT is to help management make
strategic decisions even when they result in a major direction
shift for the company.
Just as Thomas J. Watson in 1933 made a bold strategic
move based upon his assessment of future developments, under
John Akers IBM made a significant strategic mode in eliminating
this division in 1990.
But then IBM was thrown into turmoil by the revolution
that took place with PC’s and the back office linking PC’s in
the early 1990’s. IBM suffered because it’s then strategy failed
to emphasize customer relationships.
This all changed with the arrival of Louis V. Gerstner
Jr., as the first CEO hired from outside since Thomas J. Watson,
Sr.,. Again this
resulted in a major strategic shift for IBM.
For the case of Gerstner he shifted IBM’s emphasis back
to the customer resulting in large amounts of shareholder value
being added to IBM.
IBM is not an isolated example.
Another more recent example of external threats and
strategic responses is the electronic book reader.
Once these became widespread after Amazon popularized
it’s Kindle, traditional booksellers could be out of business
very quickly. This
actually happened for the case of Borders whereas Barnes and
Nobel was able adjust their strategy to embrace this new model.
SWOT analysis is designed to avoid this type of worst case
scenario by identifying threats and reformulating strategy.
The Internal Analysis that arises from SWOT usually
result from traditional financial statement analysis.
The External Analysis components of SWOT often result
from Porter’s Five Forces Framework, described in the next
topic.
What is SWOT Analysis?
•
Internal Analysis
•
Strengths:
What are the firm’s comparative advantages over others in the
industry?
–
Best product, cool products (strong consumer ratings), 1st
mover advantage, strong balance sheet, strong innovation, strong
CEO e.g., IBM’s L.V Gerstener Jr first CEO hired from outside of
IBM since Thomas J. Watson Sr.,.
•
Weaknesses:
What are the firm’s comparative disadvantages relative to
others.
–
Is it too dependent upon a CEO when they stand down (e.g., KO’s
Roberto C. Goizueta 1981-1997, Steve Job’s Apple), weak balance
sheet, weak product lines (bad consumer ratings), little
innovation
•
External Analysis
•
Opportunities:
external opportunities for growth
–
IPAD (Apple and Microsoft – the latter passed it over after
developing it first)
•
Threats:
external threats in the environment that can result in
negative growth
–
Smart Phones which has nearly knocked out Nokia, e-readers which
did bring down Borders
•
External Analysis often starts from Porter’s Five Forces
Framework, described next.
External Analysis and Porter’s Five Forces Framework
This was first presented in 1979 in a Harvard Business Review article titled: “How Competitive Forces Shape Strategy.” It identified the following forces as driving competition among firms in a given industry. These forces are:
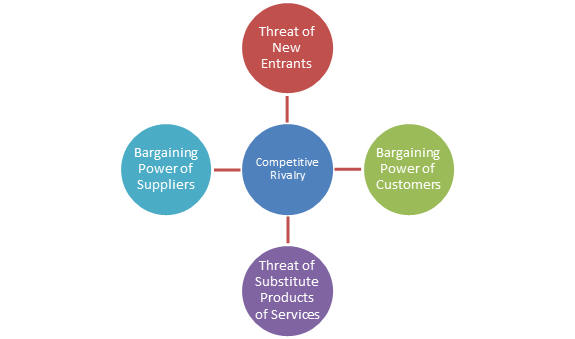
Figure 5: Porter’s
Five Forces
Together the first four forces determine the Competitive Rivalry
within an Industry.
Porter argued that collectively these five forces determine the
ultimate profit potential of the industry and the essence of
business strategy is dealing with competitive rivalry. This in
turn means that these five forces plus the business strategy
should be reflected in profitability measures for industries as
reflected in aggregate financial statements.
Valuation Tutor allows you to perform this type of
analysis across sectors and industries for a wide ride range of
profitability measures.
The above discussion has been aimed at developing your skills
for identifying and
understanding a firm’s business strategy.
In the next section we introduce a tool that is used to
communicate and evaluate
a firm’s business strategy.
Business Strategy and the Balanced Scorecard Analysis
Another technique that is designed for both communicating and
evaluating a firm’s business strategy is called the “balanced
scorecard.” It
takes a broader view and looks at both financial and
non-financial measures.
It looks at a company from four perspectives: financial
(items like earnings), customer satisfaction, business process
(which includes the activities performed by the firm), and
“learning and growth” which tries to measure innovation (and
therefore is a way to think about the future prospects of a
company). The
Balance Scorecard explicitly considers how the firm’s business
strategy impacts upon these four perspectives.
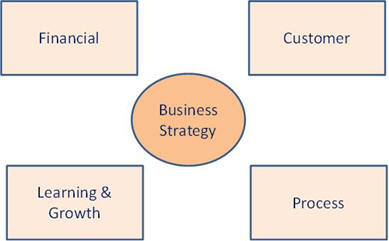
Figure 6: The
Balanced Scorecard
The balance scorecard represents business strategy in terms of
four perspectives:
•
“Financial” perspective requires looking at measures that
are relevant to the valuation of the company by shareholders.
•
“Customer” perspective requires the identification of
performance metrics that measure the company’s success in
meeting customers’ expectations viewed from the customer or
outsider’s perspective
•
“Process” perspective refers to the internal
activities performed by a firm – business efficiency
•
“Learning and Growth” perspectives refer to employee and
informational activities requiring innovation and continual
improvement.
Combined this allows for both the communication and evaluation
of a business strategy at different levels of the organization
and in this capacity is a popular topic in a management
accounting course.
Management accountants design a comprehensive set of performance
measures (both financial and non-financial) to measure the
impact of the business strategy upon the different parts of the
organization.
From an analysts’ perspective this provides a useful framework
for assessing the effects of a business strategy. This is
because the effectiveness of a business strategy will eventually
show up in the financial statements and supporting notes to the
accounts.
For example, consider a firm that produces a great product but
poor customer service.
After some time, you would expect this to be reflected in
sales. Similarly, a
company that does not invest in learning and growth will
eventually lose competitive advantage, and this will be
reflected in its financial performance.
In our earlier example, for Coca Cola pre and post the
acquisition analysts will be evaluating the impact upon three of
the above four dimensions.
First, the new strategy has placed more emphasis upon the
Process dimension and evaluating the business efficiency of this
dimension becomes important.
In turn this allows more emphasis to be placed upon the
customer because of the greater access to information and
flexible scheduling at the regional level.
This will be reflected in sales and marketing.
Finally, at a combined level the overall effects of this
investment decision will be reflected in the financial
dimensions.
The above discussion makes clear that a full evaluation of a
company cannot take place with just one year’s financial
reports; how various ratios change over time is also important.
In financial statement analysis, looking at performance
across time is called “horizontal analysis.”
Step 3: Financial
Statement Analysis
This leads us to the two main questions posed in the book:
•
How do we measure how well they are performing in these
tasks, i.e., how successful are they in implementing their
business model?
•
How much value are they creating, i.e., what is it worth?
These are answered in two ways: the first uses financial
statement analysis, the second calculates an intrinsic value for
a company using valuation models.
An overview of valuation models is in the next section.
In this section, we focus on financial statement
analysis.
Let us start with measuring performance.
One way is through financial statement analysis, which
actually encompasses different methods, including ratio
analysis, common size analysis, and activity analysis.
Ratio analysis involves studying the financial reports of
a company to understand its strengths and weaknesses.
It lets you analyze a company’s performance along
multiple dimensions.
For example an important ratio in financial statement
analysis is return on assets, or ROA, defined as profits divided
by total assets.
Total assets are defined as everything the company owns that can
be used to produce income, and therefore measures the resources
that are available to the company’s managers. ROA measures how
productively the assets are being converted into profits.
Ratios such as ROA also provide a basis for comparing
companies.
There are many forms of ratio analysis.
The origins of ratio analysis can be traced back to bank
lending, which used such as the current ratio (which measures
the company’s ability to pay back its short term debt).
At the beginning of the 20th century, the DuPont model
became a popular way to analyze performance; it consists of
decomposing ROA into three sub ratios.
Ratios are typically classified by what they are trying
to measure. For
example, liquidity ratios (such as the current ratio) measure
the ability to pay back short term liabilities.
Solvency ratios measure the ability to pay back long-term
debt. Profitability
ratios (such as ROA) measure how well the company creates
profits from its operations.
Activity analysis ratios (such as the inventory turnover
ratio described below) measure how well the company is managing
its resources.
A ratio such as ROA is a broad measure.
You could also look more deeply into how the profit (also
called the net income) is created from the total assets.
One ratio that gives you deeper insight is called the
degree of operating leverage, which measures how sales are
converted into profits.
Analysis of working capital provides more insight; it
deals with short term operations.
For example, you could look at the inventory turnover
ratio, which tells you how quickly you are selling products.
Other ratios give you insight into how it might perform
in the future. For
example, the current ratio tells you something about a company’s
financial strength; it measures the ratio of current assets
relative to its liabilities.
If you have too many liabilities relative to your assets,
your future prospects may not be as bright as those of other
companies.
Interestingly, this was one of the earliest ratios used by U.S.
commercial banks in the 1890’s when they requested financial
statements from companies wanting to borrow money (see Horrigan
1968).
In summary, ratio analysis provides you with a way of measuring
performance and also provides a way to compare performance
across firms. But
the ratios cannot be interpreted in a vacuum; it is important to
know the business model (what the company does) and the strategy
(how it plans to do it).
For example, consider a web design company and a
retailer, who have very different business models. For the
retailer, it makes sense to want a high inventory turnover; you
do not want products sitting on a shelf or in a warehouse.
But for the web design company, there is no real
inventory that is being sold.
So comparing these two very different companies along
this dimension is not very useful.
Common Size and Activity Ratio Analysis
Financial statement analysis encompasses other techniques as
well. These include
Common Size Analysis and Activity Analysis.
Vertical Common Size analysis re-expresses the major
financial variables to make them comparable across companies by
adjusting for size.
For example, suppose company 1 has $1b in assets and another has
$10m in assets.
Simply looking at their earnings would not give you much
information. But if
you divide earnings (and all other variables, such as sales) by
assets, you can get a more meaningful comparison of the
companies. In fact,
recent research has shown that investment divided by total
assets can tell you a lot about stock returns and how stocks
prices react to earnings announcements made by firms (Chan,
Novy-Marx, and Zhang (2010) and Wu Zhang and Zhang (2009).
Horizontal Common Size analysis is similar, except that it
adjusts for time by re-expressing the variables in terms of a
base year. So
current variables are then percentage changes from the base
year, and this lets you see how fast different variables are
growing. This is
especially useful in evaluating the effects of a change in
business strategy.
In any analysis of a company, business strategy matters.
Consider a luxury retailer, who sells a few high price
items during a year, and a discount retailer, who sells lots of
inexpensive products.
Both are retailers, but they have different business
strategies. And we
expect their ratios to reflect that: one should have a higher
profit margin than the other. If the luxury retailer has low
profit margins (profit divided by sales revenue) and low
inventory turnover, it is not performing very well.
We expect the discount retailer to have a low profit
margin (after all, that’s what discount means!) but to make it
up in volume, i.e., have a high inventory turnover.
So how do you know what to look for?
This can be complicated.
After all, the operations of a large multinational
company can encompass many different activities.
How do you think about the business model and strategy of
such a company in a manageable way?
Over the years, different methods have been developed for
broadly classifying models and strategies.
These methods give you a framework for thinking about a
company without having to work through every detail of the
company’s operations.
We cover some of these in Chapter 4, and give you a brief
overview here.
Major Firm Decisions
Having decided on a strategy, a company carries it out by making
different types of decisions. In the case of our bookstore,
there are many such decisions.
For example, should you focus on more expensive hard
cover books (which generate more profits per book but sell fewer
copies) or on paperbacks?
How much should you spend on employee training so they
can help
customers? Should
you advertise or rely on people walking by?
How many discounts should you offer?
Should profits be used to expand or be paid out to the
owners? Should you
borrow from a bank to finance operations or only use the owner’s
capital?
These are all strategic decisions.
Usually, they are separated into three categories:
·
The investment decision: any decision that has to do with
allocating resources.
For example: whether to invest in a new computer system
that can make tracking inventory and sales more efficient.
·
The financing decision: how to pay for operations and expansion.
For example: borrowing from a bank, issuing bonds,
issuing shares.
·
The dividend decision: how much of the profit to pay to
shareholders
In Chapter 4, we will describe these decisions and their
relationship to the business strategy of different companies.
But we should mention that in recent years, more and more
attention is being paid to another important decision: the risk
management decision.
Pretty much every business model entails some risk.
These risks come from several factors, including general
economic factors such as a slowdown or expansion of the economy,
global events such as wars, financial factors such as changes in
interest rates or exchange rates, and technological changes.
But by thinking about the risks that matter most to your
business, you can decide what risks you do not want to take.
A simple example is using financial derivatives to hedge
interest rate or exchange rate risk.
A more complex example is to locate your manufacturing
plants in different countries to diversify the risk of political
upheavals.
The results of the decisions a company makes are reflected in
their financial statements.
In Chapter 3, we introduce tools used by analysts and
management to analyze the performance of the firm's investment
decision. In
Chapter 3, we study how the market “values” the firm’s
investment decisions.
This links the internal assessment to the external
assessment; you could think you are doing well, but investors
may not agree.
Chapter 3 also introduces ratios that result from the firms
financing and dividend decisions, and in Chapter 5, we again
look at how the market views these results.
The primary ratio that reflects the investment decision is the
Return on Assets (ROA), defined as the ratio of Net Income to
Total Assets. This
basically measures how much profit is being generated by the
assets.
The financing decision is reflected in what is called the
Financial Leverage Ratio (FLR).
This is the ratio of Total Assets to Shareholders Equity.
The latter measures the capital of the firm “owned” by
the shareholders, formally defined as the difference between
Total Assets and Total Liabilities.
If the Financial Leverage Ratio is high, then a
relatively small percentage of the assets are owned by the
shareholders, and so the rest of the assets have been obtained
by borrowing.
The product of ROA and the Financial Leverage Ratio is called
the Return on Equity (ROE); it is the ratio of Net Income to
Shareholder’s Equity, and therefore measures how much profit is
being generated per unit of the capital of the firm that is
owned by the shareholders.
The dividend decision is reflected in the Retention Ratio (RR),
which is the percentage of earnings that is retained by the
firm. One minus the
Retention Ratio is called the Payout Ratio, and is the
percentage of earnings that are paid out as dividends.
The three decisions come together in the definition of what is
called Fundamental Growth (or
Accounting Growth):
Fundamental Growth = ROE * RR
In Chapter 4, we will explain what this is in detail, but for
now, note that it can be written as:
Fundamental Growth = ROA * FLR * RR
This quantity therefore reflects all three decisions.
In turn, each of these ratios can be decomposed further,
providing more insight into the effectiveness of a firm’s
strategy. These
include Working Capital Ratios, Cash Management and Liquidity
Ratios, Activity Analysis of Operations, Profitability Ratios,
Solvency Ratios. The details of all these, and their
interpretation in light of a company’s business strategy, are
the focus of Chapter 4.
In summary, the financial statement analysis part of Valuation
Tutor proceeds as follows.
In Chapter 2, we show you how to get company filings from
the SEC site, and explain the various financial statements.
In Chapter 3, we develop the ratio analysis, complete
with examples and a detailed explanation every calculation
performed by Valuation Tutor. This reconciliation is critical to
understanding some of the nuances that arise and some of the
assumptions and judgments that have to be made in the analysis.
Chapter 4 focuses on the interpretation of results to help you
understand how ratio analysis can be used to evaluate and
compare firms.
Finally, Chapter 5 extends the analysis to price based ratios.
This chapter asks how the market view performance along
the dimensions identified in Chapter 3.
This is important for what is called relative valuation.
The most popular price based ratio is the Price to
Earnings (P/E) ratio, which measures how “valuable” the earning
of a company are.
But there are many other ratios as well, and you will see how to
use them in Chapter 5.