FTS Treasury Calculator
 Restart to return home
FTS Treasury Calculator
Welcome to the Treasury Calculator Module. This module is designed to let you analyze current yield curves, forward curves, yield curve smoothing, compute position values and risk management measures. You can automatically retrieve current data from the web to perform this analysis or provide your own data that you have stored in a spreadsheet.
How Do I Get Started?
Step 1: To
automatically retrieve data from the web select Federal Reserve Data from
the drop down menu and then click on the button Get Data. You will see
the grid fill up with data once it is retrieved.
Finally, if the quote date from
your PC is different from the reported quote date because of time zone or
other differences then you can correct this manually to match the date of the
disclosed data. Now you are ready to work with
this data. Note: You can also read
in your own data from a spreadsheet. This greatly enhances the
applicability of the Treasury Calculator module. Click on how
to read in from a spreadsheet to see how. Step 2: Click on
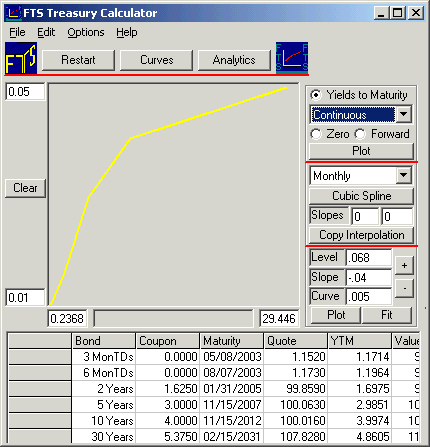
the button titled "Curves." The above screen appears.
This lets you plot and analyze the yield curve in different ways. That
is, you can plot the yield curve (plots yield to maturity against maturity for
each instrument), Zero Curve (bootstrapped implied zero coupon bond curve) and
the bootstrapped Forward Curve. In
addition, you can choose what compounding assumption you want to represent the
curve in. Smooth Approximations to the Yield
Curve Yield curves can only be
inferred from the set of available market prices. This means that in
practice they will appear, as displayed in the display window, as appearing to
have linear sub-segments. If it is assumed that the actual curve is
better described as being smooth then some type of interpolation must be used.
In this module you can apply two techniques, a Cubic
Spline approach or a Nelson-Siegel approximation. Note: If the original curve is inverted, a cubic spline approximation
may not perform well in practice. Step 3: Click on
the button "Analytics" This is subject lets you compute
duration, convexity, dollar duration (i.e., duration times value) and dollar
convexity numbers for the existing instruments plus any position you want to
paste in. The advantage of pasting in a
position of cash flows is that the value and the risk management statistics
are computed relative to the current yield curve. The position you paste
in can be an instrument, fixed income portfolio or even an investment
project. Step 4: In this
same Analytics subject you can use the calculator to engineer your own fixed
income position from the instruments you have provided. For example you
can input the target value and a target $ duration and the calculator will
solve for the position that maximizes yield or minimizes convexity. For example, if your target $
value is 10000 and target $ duration is 20000 then your target duration is
2. Now you can observe what instruments are required in a position that
maximizes yield versus minimizing convexity. Current Developments As a user, you are encouraged
to provide feedback as to what type of flexibility you would like to be
added. You can do this by using the forum at www.ftsweb.com
or by sending email to fts@ftsweb.com.
OS Financial Trading System, PO Box 11356, Pittsburgh, PA 15238 USA, Phone 1-800-967-9897, Fax 1-412-967-5958, Email
fts@ftsweb.com,
(C) Copyright 2000, OS Financial Trading System