Trading Case XR1
Case Objective
To understand using options
and futures to manage currency risk; to understand options trading strategies.
Key Concepts
Currency option and futures
pricing; option hedge parameters. Delta hedging
Case
description
Financial markets have
become increasingly global and the need to manage exchange rate risk has become increasingly important. Trading case XR1 introduces you to using some
of the tools and trading strategies that get employed in the field. See the appendix to this case for Trading
Tips on this case.
"Private" Information
In this market you are a price-taker. That is, you can trade options and a future
at the current available price. You
have, however, some additional private information that has not been incorporated
into the available derivative prices.
Your information is that
you know for sure that at some time during the trading trial the exchange rate
will take a significant "jump."
However, the magnitude, direction and timing of the jump is random. In
addition, once a jump is realized it is possible that additional independent
jumps can occur.
In the XR1 trading
exercise your objective is to make money.
As a result, you should think through what type of option trading
strategies can best exploit your knowledge of how the trading period will
unfold. If at any time you want “lock
in” trading gains you can always manage the delta of your position to try and
do this. For example, a delta neutral
position manages the exposure of your position to changes in the underlying
exchange rate.
As a trader, your
performance is measured in terms of how well you use this information for
trading, relative to all other FTS
traders.
Trading Screen
Each trader's screen will
monitor the following markets: the spot exchange rate (S) for a basket of foreign currencies (bfx). In particular, the exchange rate is 500 units
of the basket (bfx) for x units of USD, where x will
fluctuate in line with the spot exchange rates.
The default free US treasury strip with 2 years remaining to maturity at
the start of the trading period, European call and put options on the exchange
rate for two different strike prices, an exchange rate futures market, and a
cash money market.
Definition of A Trading Trial
One trial in this case is
almost 12 months, but time is condensed so that two weeks is equal to “n”
seconds. That is, throughout the trial
trading is continuous but prices will change in discrete time, two week steps
every “n” seconds of FTS time. That is,
in calendar time the markets are open for FTS traders on the first trading day
of every two weeks.
Note: In the
default form of the case “n” seconds equals 20.
The following table
describes price changes in this market:
|
Calendar Time |
Real-time |
|
|
|
|
Day 1, Week 1 |
Time 0-20 seconds |
|
Day 1, Week 3 |
Time 21-40 seconds |
|
Day 1, Week 5 |
Time 41-60 seconds |
|
....................... |
............................... |
New prices are realized
for each trading Day (20 second interval).
Prices reflect the underlying difference in calendar time. That is, the Treasury Strip appreciates
toward its face value over time, and option prices reflect the time left to
maturity etc.
Market Environment
The first market is the
exchange rate. This is the value of 500 bfx in $US. Analyst
research has indicated that the statistical process that approximately
describes the behavior of this exchange rate is a geometric Wiener process with
the following properties:
|
Outside Market's Projected volatility of return () |
12% per annum |
|
Spot Index Value (Bid/Ask) |
Near 300 |
|
Projected Drift () |
0.0% per annum |
|
Unit of Time |
2 week (20 seconds) |
|
Eurodollar rate US |
0.03 |
|
Euromark rate |
0.07 |
The projected volatility
is a little above historical averages for volatility
but well below the heights reached in the European currency crisis in 1992.
Time
Two weekly bid and ask
realizations for the spot exchange rate are updated every 20 seconds on the FTS
trading screen. The size of the spread in this market is stochastic.
At the end of the year ( = one trading trial), your currency position is
marked-to-market at the prevailing rate.
Other Financial Contracts
The second security
market is a risk-free
Securities 3 through 6
are European currency options (put and call) defined on the underlying spot
exchange rate. The strike or exercise
prices for these options are 290 and 310 (in $US). That is, the call option with a strike price
equal to 290 provides its owner with the right, but not obligation, to acquire
500 bfx for $US290 at the end of its life. The time to maturity for each option in the
FTS markets is initially 1 year and declines every second until the options
expire.
The terminal payoff for
each option depends upon the realized exchange rate after the FTS markets are closed
(i.e., at the end of the year). Thus,
the 290 Call and 310 Put have terminal values computed as follows:
Terminal Value:
![]()
![]()
At the end of their life
options are automatically exercised if they are "in the money."
Finally, the seventh
market is a currency market future. This
contract is an obligation to deliver 500 bfx in 52
weeks time.
Security Summary And Trading Restrictions
|
Financial Markets |
|
Spot x-rate (500 bfx) in $US (S) |
|
US Treasury Strip (maturity 104 weeks) |
|
52 week call on spot x-rate, Strike 290 |
|
52 week Put on spot x-rate, Strike 290 |
|
52 week Call on spot x-rate, Strike 310 |
|
52 week Put on spot x-rate, Strike 310 |
|
X-rate Future (500 bfx / 52 weeks) |
|
Money market (3% p.a.) |
You are not permitted to
trade directly in the spot x-rate market.
Stochastic Bid Ask Spread
In this case FTS traders
are market takers who face a stochastic bid/ask spread for each security. The mean of this spread approximately
coincides with theoretical prices (ignoring your private information). However, the range around the theoretical
price increases as we move from Treasury strips, exchange rates, exchange rate
futures, call options, to put options.
That is, on average the spread is the largest for currency put options
and smallest for the Treasury strips.
Initial Trader Positions
|
Type A |
Endowments |
|
Cash |
$114,000 |
|
Call 290 |
-2000 |
|
Type B |
Endowments |
|
Cash |
$127,300 |
|
Put 290 |
-2000 units |
Trading Restrictions
You cannot trade the
exchange rate.
You cannot trade the
option you have a starting position in.
That is, Type A cannot trade the Call 290 and Type B cannot trade the
Put 290 above.
You cannot trade lot
sizes that exceed 10000 units. However,
over time any quantity can be traded at the prevailing spot price by trading
multiple lots.
You can shortsell
securities or borrow cash at the prevailing interest rate to purchase
additional securities if you are short cash.
Any cash shortfall/surplus automatically earns the prevailing rate of
interest. The risk-free rate of interest
is 3% per annum (continuously compounded and marked each 20 seconds (two
weeks)). Your trading objective is to
earn as much grade cash as possible.
Earning Grade Cash
In the trading period
securities are exchanged using market cash.
A trading period lasts for 52 weeks of calendar time which is referred
to as one trial. Multiple independent trading trials will be
conducted. That is you will restart with
an initial endowment (that is either type A or type B) and an independent time
path for the exchange rate is generated starting from a spot value around
300. At the end of any trial you will
earn grade cash as follows:
![]()
The upper and lower bounds for market cash are
-$100 million and +$100 million. Outside
of these bounds no further Grade cash is earned or lost. Trading is conducted over a number of
independent trials and a record of your cumulative grade cash is maintained.
Linking to the
Trading Support
Download the trading support spreadsheet from the
Virtual Classroom page and open it in Excel.
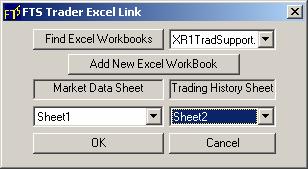
Launch the FTS Trader and link to the market. In FTS Trader click on the File menu and
select Excel Link from the sub menu items.
The following screen will pop up.
Select the spreadsheet titled XR1TradSupport and be sure to select Sheet
1 as the Market Data Sheet and Sheet 2 as the Trading History Sheet as depicted
below:
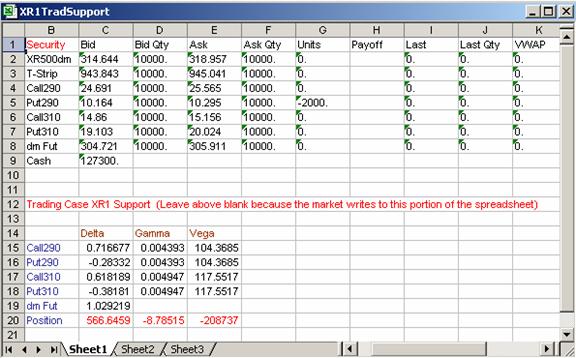
Click OK and the spreadsheet is automatically linked
to the market. By giving focus to the
spreadsheet (i.e., resize so it is on the same screen as your trading window),
you can see your position greeks
update in real time. The spreadsheet
support is illustrated below:
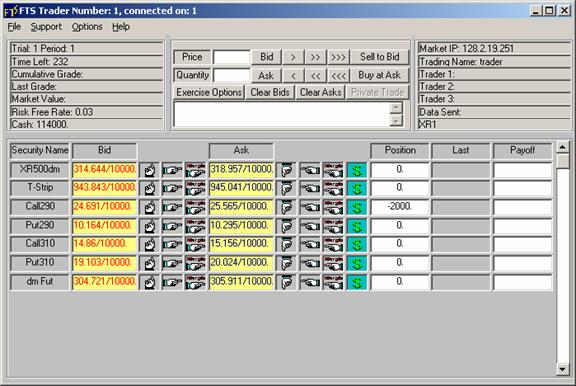
Corresponding Trading
Screen in the FTS Trader
Appendix
Trading Tips for Trading XR1
In
trading case XR1 you are a short term “news trader.” You have information that lets you form a
“market view” about the short term price behavior of the underlying exchange
rate. In XR1 the price of the underlying
exchange follows the geometric Brownian motion process assumed by Black and Scholes with one important difference. During the trading period at least one
significant economic news event will occur that will result in the price of the
exchange rate taking a jump. However,
you do not know when the jump will take place or it’s
magnitude and direction. In addition,
there may be more than one significant jump (but there will be at least
one). Unlike the real world you do not
face any liquidity or capital constraints.
You
have an initial position in an option that you cannot trade, but you can trade
the remaining derivatives (option and futures).
As a result, your task is to manage your trading strategy so that it
makes money if your view of the market is correct. At any time if you want to lock in your
trading gains you can also manage the delta of your position. By linking to the XR1 support spreadsheet
(you can download this from the Virtual Classroom page immediately below where
you download the FTS Trader from).
Why Delta?
Delta
is a measure of the dollar sensitivity of your position to changes in the
underlying (i.e., the exchange rate).
Formally, the delta of a derivative security is the partial derivative
(i.e., calculus) of the derivative security’s price w.r.t.
a change in the underlying asset price.
The delta of each security and your position’s delta are provided in the
support spreadsheet in real time.
Excel Note for FTS Trader: If Excel is set
to Automatic Calculate (Tools, Options, Calculations, Automatic) and you link
FTS Trader to this spreadsheet, it will automatically recalculate your position
delta whenever the exchange rate changes in XR1.
By
trading the options and futures you can manage your position delta to be
approximately zero, positive or negative.
For the case of a zero position delta your position’s value will be
relatively insensitive to shifts in the underlying exchange rate. If you assume a large positive position delta
your position will be very sensitive to shifts in the price of the underlying
(with increasing sensitivity the larger your position delta is). That is, if the underlying exchange rate
increases so does your position’s value and if the underlying exchange rate
decreases your position value will decline.
Finally, if you assume a large negative position delta then the value of
your position responds in the opposite way to the change in the exchange
rate. That is, if the exchange rate
increases your position’s value decreases and vice versa.
Finer points: Your position
gamma is a measure of how sensitivity your position delta is to changes in the
underlying. Formally, gamma is the
partial derivative (in calculus) of the derivative security’s delta w.r.t. the underlying asset price (i.e., the second partial
derivative w.r.t. the underlying asset price). In the field, suppose a dealer is hedging the
exchange rate risk by maintaining an approximate delta neutral exposure (i.e.,
position delta equals 0). If a dealer
maintains a gamma sensitive (i.e., large position gamma) position they must
adjust delta frequently and by larger amounts to maintain a zero position
delta. If a dealer maintains a gamma
insensitive position (i.e., approximately zero position gamma) then this
reduces the frequency and size of delta adjustments that need to be made to
maintain a zero position delta. In
practice by reducing the size and frequency of having to adjust your position’s
delta results in a source of significant transaction cost savings.
Finally,
your position Vega is a measure of how sensitive your position is to volatility.