Trading Case
IN1
Case Objectives
To understand the relationship between spot and
forward stock index prices. To examine
the potential impact that opening a forward market has on spot prices.
Case
description
In this trading case you can trade in two stock
index spot markets and one stock index forward market. In each market you can i. submit limit orders
to buy/sell quantities up to 10000 units at a time, (i.e., make market) and ii.
submit market orders to buy or sell some quantity (i.e., take market) up to
what is currently available at the best bid or ask. The former requires submitting bids and asks
to buy and sell, whereas the latter requires that you sell to a prevailing bid
or buy from a prevailing ask. Short
sales, and borrowing (lending) in the money market are all permitted. Trading takes place for the first day of the
calendar year only. Any net surplus
(deficit) of cash you end the first trading day with accrues (pays) interest at
the rate of 5% for the remaining year (i.e., compounded annually). Settlement in the forward market is at the
end of calendar year as described in the markets section. At this time your positions in the two index
markets are also marked to the realized end of year index value. That is, all positions are converted to cash
at the end of the calendar year and your trading bonus is determined.
Markets
Opening Trading Screen
The opening screen appears as follows. The markets are described below.
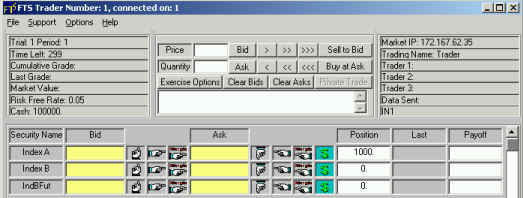
Market 1 is called “Index A.” This market trades a basket of stocks that
exactly replicates a stock index called A.
At the end of the year this basket is marked to the realized value for
stock index A. Market 2 is called “Index B.”
This security is also a basket of stocks that exactly replicates a stock
index called B. Again at the end of the
year this basket is marked to the realized value for stock index B. Both markets A and B are spot markets and the
stock indices A and B are identical except for the fact that their realizations
are completely independent. That is, if
A is high then B can be any of the feasible values provided below.
Marked Value
for Index A and Index B
The set of possible end of year realizations for
each stock index are: {7900, 12100}.
Each realization is equally likely and the realization for index B is
independent of the realization for index A.
Market 3 is a forward contract
defined directly on index B. It is cash
settled at the end of the year and is quoted so that 1 forward contract
corresponds to 1 unit of index B.
Market 3: Forward Contract Long Forward Contract
Example
Suppose you could buy or sell the forward contract
at 10,000 during trading (day 1 of the year) and your current position in Index
forwards is zero. If you buy 1 unit of
the forward contract you are now long one contract and the following
transactions result:
Trading Day 1 of the Year: Cash balance is not affected by buying the
forward contract (i.e., zero cash is exchanged at the time of the trade). Units balance for the forward contract
increases by 1 (so current balance is +1 to reflect the long position).
End of the Year:
You are obligated to settle the forward contract at the price agreed to
at the time of trade (e.g., 10,000 in current example). Cash is reduced by 10,000 and in exchange you
receive 1 unit of the underlying index B.
This has a realized value = ST. So the net cash transferred into or from your
cash account is: ST –
10000.
Market 3: Forward Contract Short Forward Contract Example
Suppose you could buy or sell the forward contract
at 10,000 during trading (day 1 of the year) and your current position in Index
forwards is zero. If you sell 1 unit of
the forward contract you are now short one contract and the following transactions
result:
Trading Day 1 of the Year: Cash balance is not affected by selling the
forward contract (i.e., zero cash is exchanged at the time of the trade). Units balance for the forward contract
decreases by 1 (so current balance is -1 to reflect the short position).
End of the Year:
You are obligated to settle the forward contract at the price agreed to
at the time of trade (e.g., 10,000 in current example). Cash is increased by 10,000 and in exchange
you must give up 1 unit of the underlying index B. This has a realized value = ST. So the net cash transferred into or from your
cash account is: 10000 - ST.
It is your task, as part of the trading crowd, to
discover prices for the spot and forward markets during the first day's
trading. A trading session consists of
multiple independent trials. Your
trading bonus is cumulated across trials.
Trading Objective
Your aim is to make as much money as you can and
your trading bonus = 0.0001*total end of year market cash.
Spreadsheet
Support
Step 1: Linking
the FTS Market to your Spreadsheet
Performing spreadsheet link is
simple. First open Excel. In the FTS Trader click on the File Menu item
and then select Excel link.
Next click on the button Find
Excel Workbooks and then select the work book you want to link to. Be sure to link Market Data and Trading
History to two different sheets. Then
click OK. The link is automatically
maintained for you in real time.
Step 2: The fixed spreadsheet cell conventions
If you choose to create a spreadsheet support system
for this trading case the following cell information is relevant:
Suppose
you link to Sheet 1 and sheet 2 as per screen shot below. Sheet 1 maintains a real time link to your
trading screen. Spreadsheet Cols run
from A (blank), B (Security), C (Bid), D (Bid Qty) etc., and rows run from 1
(Headings), 2 (Security 1), 3 (Security 2), 4 (Security 3) etc., for all
securities in the case and then followed by your cash balance.
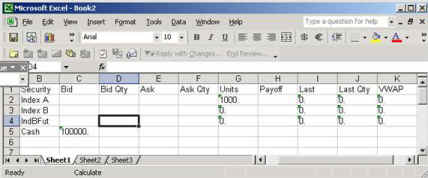
The above cells are fixed and
general across FTS cases. Once you have
linked to your spreadsheet (which you can do via the file menu item in the FTS
Trader), the first security’s bid comes into cell C2, and so on up until the
VWAP (current volume weighted average price of trades).
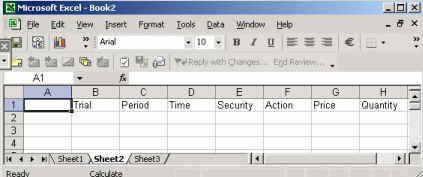
Sheet 2: Contains your personal trading
information. Spreadsheet Cols run from A
(blank), B (Trial), C (Period), D (Time) etc., and rows run from 1 (Headings),
2 (first trade), 3 (second trade), etc.,
The details for the second
sheet which contains your personal trading diary are provided below:
Tip: If you are involved in a weekend trading session it is
recommended that you have a third master sheet in your workbook to keep you
personal trading diary in. That is, if
you are logging in and out of the market multiple times you will need to keep
track of your cumulative trading diary because each time you log in the
personal trading diary starts from row 1 (as above) of the sheet you choose to
link to. As a result, if you log in and
out multiple times and want to maintain a cumulative trading record, be sure to
do either i. or ii. below:
i. Attach to a different Sheet each time so that
you have login 1, login 2 etc., recorded in separate spreadsheets or,
ii. At the time of logging out
copy and paste the data from Sheet 2 to Sheet 3 (assuming you have linked to
Sheet 2 as illustrated above). In this
way you maintain a cumulative record of your trading history in Sheet 2.
Tip: It is a good practice to back up
your Excel Workbook.