![]() Lesson: Payoff Diagrams and Option Trading Strategies
Lesson: Payoff Diagrams and Option Trading Strategies
Design
option trading strategies to take advantage of the following market views.
In each case, explain what is required for the strategy to break-even,
and analyze the tradeoff between the cost of the strategy and the potential
gain.
a)
The market is expected to move up significantly.
b)
The market is expected to be quite volatile and without a clear direction.
c)
The market is expected to trade within a narrow range.
d)
The market is expected to be volatile but with a downward bias.
e)
How can apply the above strategies to current market data?
From the
Virtual Classroom page click on the module Option Payoffs and run or open
directly from the web. The following screens will appear.
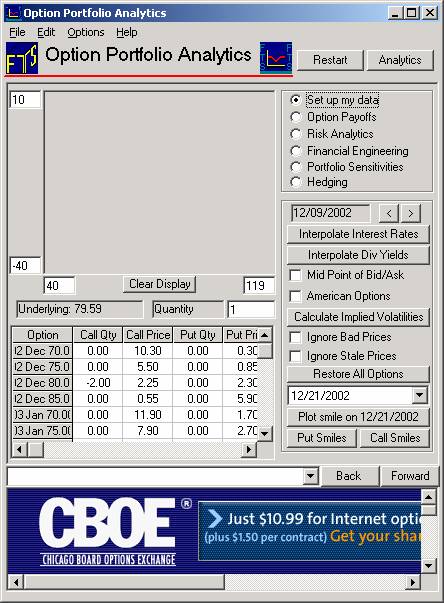
The top
window (which we call the Display Window) plots payoff diagrams for any strategy
you create. These strategies are
created in the bottom window, which we call the Action Window.
The program
starts with the default data set, which has five puts, five calls, an underlying
asset, and a futures contract on the underlying.
The options and the future mature in three months.
The purpose
of this module is to become familiar with the trading strategies.
You can enter your own data, so you can work with your own positions by
using the Option Portfolio Module. This
is covered in a later lesson. A
brief introduction to this is provided at the end of this lesson.
Working
with the default data set, you can see that the strike prices range from 40 to
60, shown in the column labeled Strike. Call
Qty and Put Qty are the quantities you hold (your position), and the Call Price
and Put Price are the market prices of the options.
Part a) of
the exercise asks for strategies that bet on a significant up movement in the
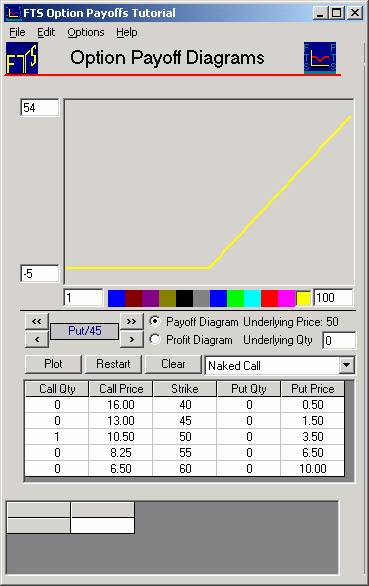
underlying asset. The simplest
strategy to take advantage of this view is to buy a call option, say the
45-strike call. The next figure
shows you how to use the Action Window.
First make
your selection from the drop down menu beside Naked Call (i.e., leave drop down
menu as is). To analyze the effects
of buying one 50-call, your Action Window should look like this:

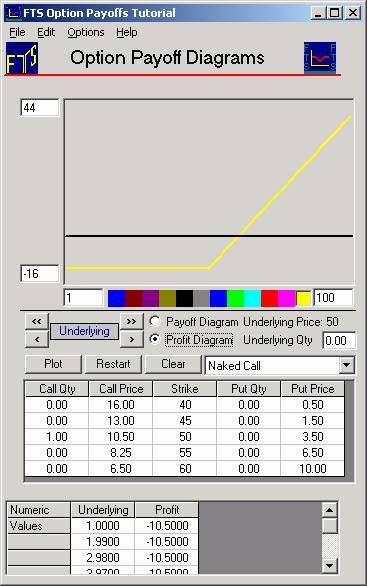
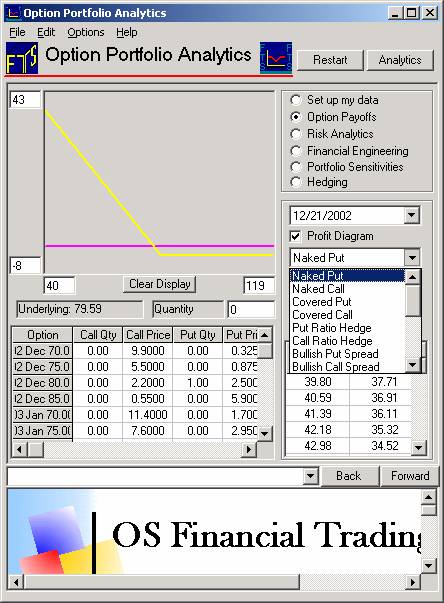
If you
select Profit Diagram the Display Window will show you the net payoffs from the
call (click the Refresh button if you have multiple lines on the screen):
Module
Notes:
To read off
the numbers associated with either a Payoff or a Profit Diagram see the grid
above. This displays the numerical
values associated with the current position you are working with.
You can
easily reverse the sign of any preset position by selecting the Option Menu,
Invert Position.
The
break-even analysis is as follows. If
the underlying asset would have to move up to between 60.4 and 61.4 to break
even (ignoring the time value of money). To
calculate the exact break-even point for the option, we need to solve for the S
so that:
S -50 = 10.5, so S = 60.5, where 50 is the strike price.
A more
leveraged position can be achieved by financing the call by selling puts.
For example, the 60-put costs $10. If
the market rises to break even and does not fall after the next 3 months, the
puts will be worthless. Therefore,
by selling three 50-puts, you can finance the call.
Selling the puts will net you 10.50, while the call costs 10.5.
To see the exposure you face, sell the puts to obtain the Action Window
shown next.
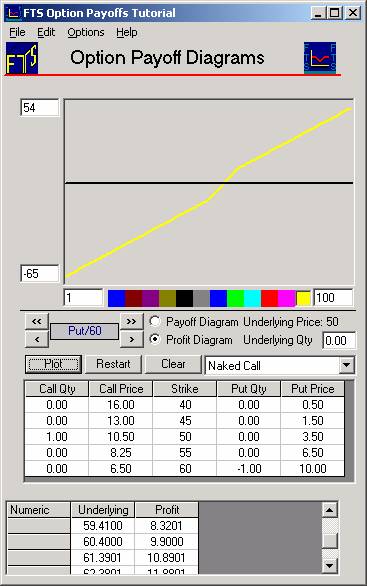
This
strategy costs nothing, but you can see that you face a far greater loss if the
stock value falls.
Note:
You should try different combinations of options, and analyze what movement in
the underlying asset is required to make them profitable.
Part b)
asks what you would do if you expected the market to be quite volatile but were
not willing to commit to whether it would rise or fall.
There are two well-known strategies that let you take advantage of such
beliefs. The first is a straddle
and the second is a (short) butterfly
spread.
A straddle
requires buying a put and a call with the same strike price.
Since there are no clear beliefs about the direction of the market, you
would buy puts and calls which were at-the-money,
i.e., with strike prices as close to the underlying asset price as possible.
For our data set, this requires buying the 50 put and the 50 call,
leading to the following Display and Action Windows.
You can select this strategy again from the drop down:
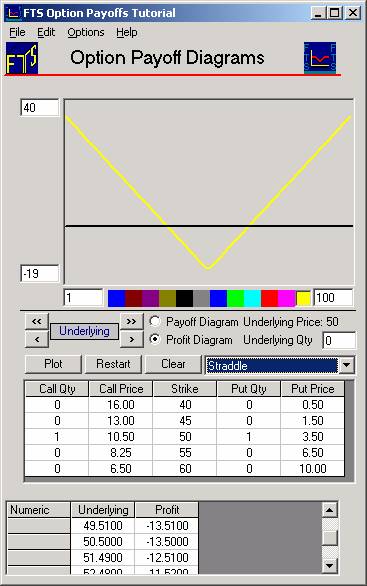
The
strategy costs 14. To break-even,
the underlying asset must move either up or down.
If it moves up, only the call will be in the money, and the underlying
must move to a price S so that S - 50 = 10.5, which gives us S = 60.5.
If it moves down, only the put will be in the money, and we need that 50
- S = 5, so S = 46.5.
A cheaper
alternative is the strangle.
In this strategy, you buy a low-strike put and a high-strike call.
For example, buy a 40-put and a 60-call.
This leads to:
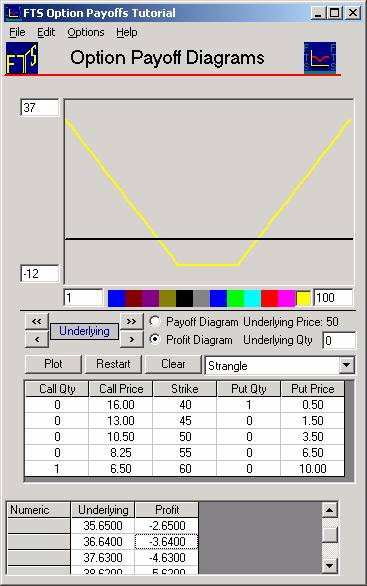
The cost
has dropped from 14 to 8 relative to the straddle.
To break-even when there is an up move, we require S - 60 = 6.5 which
implies S = 66.5. For a down move,
we require 40 - S = 0.5 so S = 39.5. In
comparison with the straddle, the moves required by the market are not that
different, but the cost of the strategy is a lot lower .
A (short)
butterfly spread is a similar strategy, except that it is constructed entirely
with puts or entirely with calls. For
example, select the call butterfly spread from the drop down menu and then click
on the Option menu. Invert Position to convert it into a short butterfly spread,
as follows:
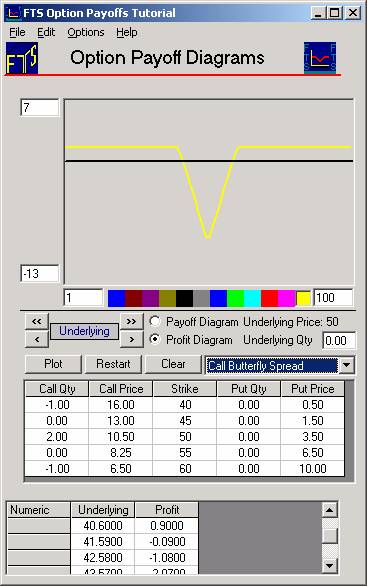
You
actually get a payment of 1.50 for executing this strategy (the selling of the
65-put more than covers the cost of the 2 55-puts).
As you can see from the picture, you get a constant profit (of $5.50) if
the stock price moves a lot in either direction.
If it moves to 55.45, you lose $3.05 (+$1.50 from initial position +
$10.90 from the 50-call minus the $15.45 you got initially).
Check this from the profit payoff grid (see above).
Note:
You should construct a similar strategy using puts.
Part c) is
the opposite of Part b). Your
beliefs are that the market will trade in a narrow range.
Part b) already suggests some strategies: a short straddle or strangle or
a butterfly spread. We do not
present details of these here since they are easily re-produced using the steps
in Part b).
Note:
You can reverse positions by selecting the Option Menu and then Invert
Position sub menu item.
A trader at
Baring’s in
Part d)
adds a slight twist to Part b): there is now a directional bias in your view of the market.
The solution is clear: you buy more things that pay off when the
underlying asset falls (or sell more things that lose when the asset falls).
One
variation here would be to buy a straddle but to buy an additional put.
This combination is called a strip
and looks like (select the Strip strategy from the drop menu as depicted below):

(The
opposite of a strip is a strap, where
you buy 2 calls and one put.)
You could
also vary the (short) butterfly spread by buying a 50-put. The on-line textbook
describes several other strategies that are commonly employed.
e)
How do I work with my own options: Application
to Current IBM Options
To define
your own options, launch the Option Portfolio Module from the Virtual Classroom:
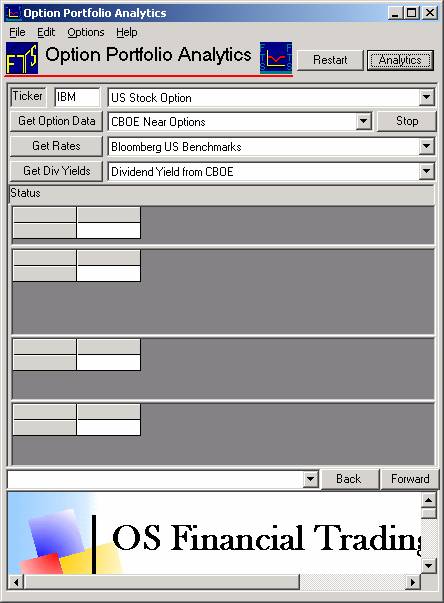
Click the
three buttons above: Get Option
Data, Get Rates and Get Dividend Yields:
By
selecting CBOE Near Options you can get a liquid subset of options trading on
IBM (or whatever ticker you enter).
Side
Module Note:
You can read in your own dataset from Excel ---- to do so select from the
drop down beside the Get Option Data button Data from Excel.
A template is available for Excel from the Help menu in this module.
When downloading the template if you are prompted for a login and
password just hit Cancel and continue. This
is triggered on some systems and should be ignored.
This brings
up:
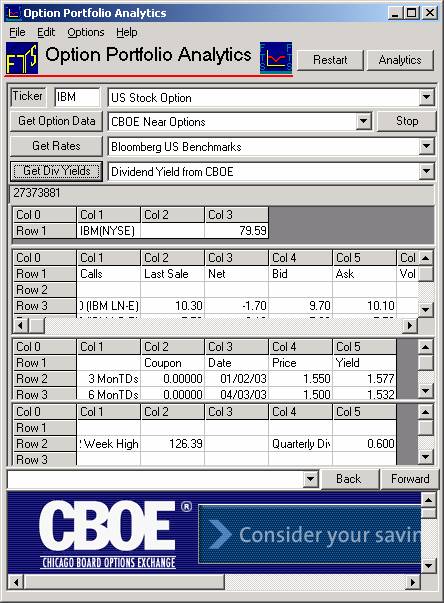
Click the
button Analytics to initialize the data.
Select
Option Payoffs as depicted below: From
the initial screen above select Option Payoffs.
The following screen will appear:
From the
above screen you can see that you have the same Option Trading Support when
using the drop down menu (depicted). The
difference is that now you are working with the current actual option prices.
©2003
OS Financial Trading System