Option
Calculator and Implied Volatilities
Using data
from the web or financial press, evaluate how well the option pricing models
explain stock option prices.
This
exercise is based on the Option Calculator Module on the Virtual Classroom.
The original numbers for this exercise were obtained closing stock option
data from the newspapers. The Option
Calculator allows you to automatically retrieve the latest data from the web.
But by working through this exercise you will learn how to apply the
calculator to the real world option markets.
Let
us use Intel as an example. On
|
Strike
Price |
Call
Price |
Put
Price |
|
55 |
9
1/4 |
7/8 |
|
60 |
5
1/2 |
1
¾ |
|
65 |
2
11/16 |
4
¼ |
|
70 |
1
1/8 |
7
¾ |
To
see how well the option pricing models explain this data, we need to know the
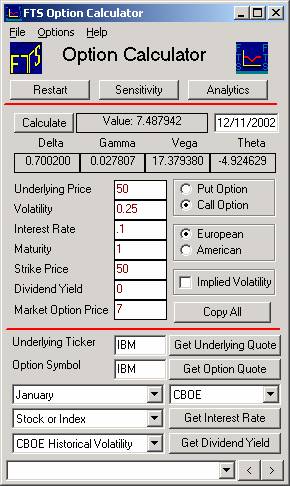
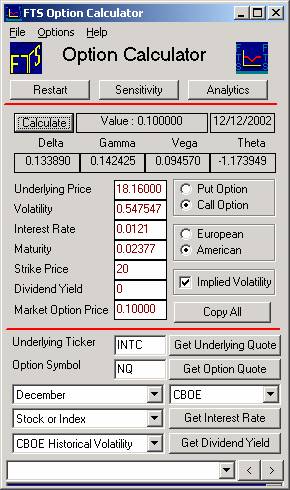
inputs required by the Option Calculator. Run
the Option Calculator directly from the Virtual Classroom page, to get:
Let
us start with the Black-Scholes model. To
apply it, we need to know the underlying asset price (which is 63 1/4), the
volatility, the risk-free interest rate, the time to maturity, and the strike
price. We do not need to worry about
the dividend yield; Intel will not be announcing or paying a dividend between
Dec 8 and the option maturity.
Lets
start with the maturity date. Stock
options in the
For
the case of this historical example we have a choice of two ways for entering
the time to maturity information. First
is to enter dates directly, and second is to use the FTS Calculator to compute
the annualized time to maturity. We
illustrate both ways next.
Maturity +
Choice of Entry Formats into the FTS Option Calculator
Current
time for example =
Date
of Maturity for the January option
You
can enter these two dates directly into the Option Calculator (
For
the case of the time to maturity
you can enter the number directly into the FTS Option Calculator (= 0.11780822).
Either form of entry (dates or number) is acceptable to the FTS Option
Calculator.
Interest Rate
The
Treasury Bill quote for the closest (1/22/1996)
maturity is 5.33.
The FTS Calculator (see screen below titled FTS Calculators) will convert
this to the continuously compounded rate:
Note:
For both of the above two entries you can use the FTS Calculator if you
want to. Launch from the Virtual
Classroom page and enter the appropriate information for settlement and T-bill
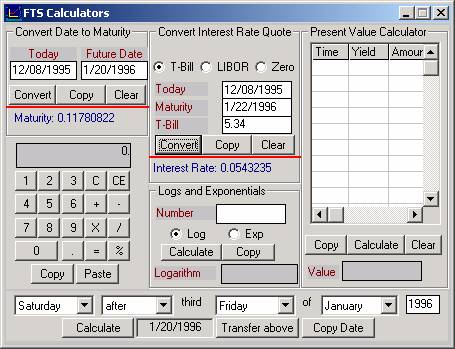
For
the option calculator we will use 0.0543 as our estimate for the risk free rate.
Spot Price of
Underlying Asset
Enter
63.25 in the Underlying Price field.
Strike Price
The
first strike price is 55, so enter that into the Strike Price field.
Finally,
set the style to American because regular stock options in the
Click
on calculate and your screen should now as follows:
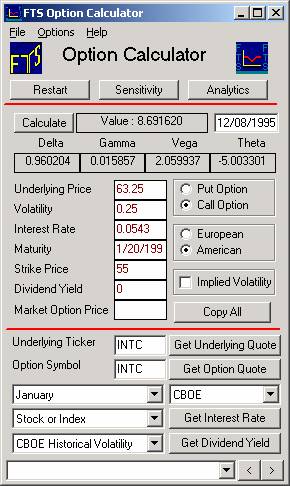
The
above is the option price with the default volatility, 0.25 (or 25%).
We have not, however, taken any care to assess volatility when estimating
the price so far. So this raised the
important question when valuing options --- how do we estimate volatility?
This is important because trading options is exactly equivalent to
trading volatility and therefore much care must be taken when entering this
input.
The
Black-Scholes price above is 8.692 with volatility set at 25%.
The market price is 9 1/4. Since
price is an increasing function of volatility, we can interpret this as saying
that our estimate of volatility is too low for Intel.
There
are two ways in which we can obtain an estimate of volatility.
One is using historical data, which would require a data set on Intel
prices. The other is to calculate
“implied volatility,” i.e., the volatility implicit in the price of the
option.
What
should we put in for volatility? One answer is to calculate the volatility which
makes the Black-Scholes price equal to the market price.
To
calculate the volatility implied by the 55-call, click beside Implied Volatility
and type in the option’s price (9 1/4) in the new field that appears and click
OK. You should now see:
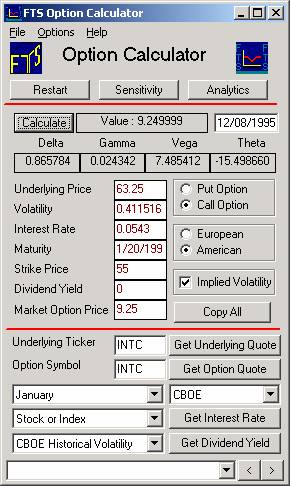
The
volatility implied by the option price is 41.2%.
Calculating
the Implied Volatility for Multiple Options
We
can calculate the implied volatilities of all the options.
Of course, if we calculate implied volatilities in this way, then the
model will fit the data perfectly.
So how do we tell whether the model provides an accurate description of
option prices? The answer comes from the fact the Black Scholes option pricing
model requires that the same
volatility work for all options.
We can easily test this out by calculating the implied volatilities of
all the options.
We simply have to change the strike prices and market prices, and then
calculate the implied volatilities for a set of options (see appendix to this
lesson for a note on how to automate this when working with your own position).
Consider
the basic set of data (let A/P denote American put option and A/C American call
option):
|
Option
Type |
Asset
Price |
Volatility |
Interest
Rate |
Maturity |
Strike
Price |
Dividend
Yield |
Market
Price |
|
|
A/P |
63.25 |
.4 |
.0543 |
.117808 |
55 |
0 |
7/8 |
|
|
A/P |
63.25 |
.4 |
.0543 |
.117808 |
60 |
0 |
1
3/4 |
|
|
A/P |
63.25 |
.4 |
.0543 |
.117808 |
65 |
0 |
4
1/4 |
|
|
A/P |
63.25 |
.4 |
.0543 |
.117808 |
70 |
0 |
7
3/4 |
|
|
A/C |
63.25 |
.4 |
.0543 |
.117808 |
55 |
0 |
9
1/4 |
|
|
A/C |
63.25 |
.4 |
.0543 |
.117808 |
60 |
0 |
5
1/2 |
|
|
A/C |
63.25 |
.4 |
.0543 |
.117808 |
65 |
0 |
2
11/16 |
|
|
A/C |
63.25 |
.4 |
.0543 |
.117808 |
70 |
0 |
1
1/8 |
|
It
is straightforward to change the strike price, option price and recalculate the
implied volatility for puts and calls respectively.
From this we can compute the implied volatilities as follows:
|
Option
Type |
Strike |
Implied
Volatility |
|
A/P |
55 |
0.4567 |
|
A/P |
60 |
0.3840 |
|
A/P |
65 |
0.3993 |
|
A/P |
70 |
0.4046 |
|
A/C |
55 |
0.4116 |
|
A/C |
60 |
0.4011 |
|
A/C |
65 |
0.3779 |
|
A/C |
70 |
0.3722 |
If
you plot the strike price versus the implied volatility for the put options, you
get:
Recall
that the stock price is 63.25, so the 65-put is closest to the money.
The graph shows evidence of the “volatility smile,” so-named because
of the shape of this curve.
For
the call, we get:
You
can see that this is less of a “smile” and more of a “smirk.”
The
results on implied volatility show that the option pricing model, which assumes
a constant volatility across strike prices and across puts and calls, does not
fit observed market data precisely.
There are several caveats that must be applied to this conclusion. First, we are not sure that we have the correct data. The stock price is taken at the close of the market, but we do not know when the options traded. Second, there is typically a bid-ask spread in the market, and the closing prices (of either the stock or the options) do not indicate whether the last trade took place at the bid or the ask. This makes a difference because the way the model calculates the value of the option is based on the prices at which the stocks and options can be traded. Third, we have not allowed for other factors such as transaction costs, which will also affect the model.
Using Current
Market Data:
Once
you have worked through and understood the above historical example you can
apply the calculator to current examples. For Intel the stock symbol is
INTC and the option symbol is either NQ or INQ currently depending upon the
strike price.
See www.cboe.com Market Quotes (click
on Delayed Option Quotes as one way of getting to the symbol directory).
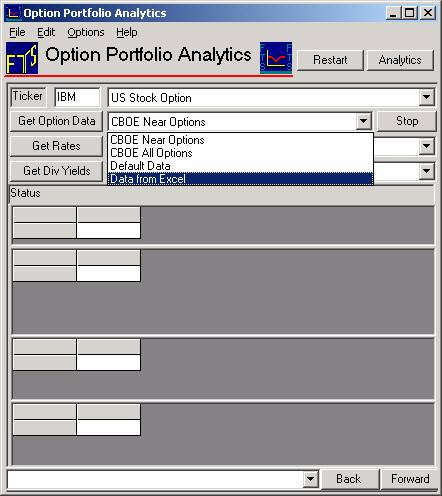
When
working with your own position involving multiple options, once you master using
the Option Calculator (the subject of this lesson), you can also use the Option
Portfolio Manager Module.
This module automates much of the tedious work associated with using
multiple option quotes.
This module automatically retrieves the latest (delayed) prices from the
web for options currently trading on the Chicago Board of Options Exchange (CBOE)
or you can link to Excel for other options. The
initial screen for the Option Portfolio Manager appears as follows:
You
will find that for Option Problems involving few options that the Option
Calculator is easier to use.
For problems involving a larger number of options and position
considerations then the Option Portfolio Module is preferred.