Restart
to return
home
 Since Yahoo Finance changed their terms and their API, the FTS Historical Equity Data Module is no longer available.
One alternative is to use this site:
at jasonstrimpel.com which allows downloading stock price data into Excel.
Note that this is not an FTS site and we cannot guarantee that it will either work as desired or be available over time.
Since Yahoo Finance changed their terms and their API, the FTS Historical Equity Data Module is no longer available.
One alternative is to use this site:
at jasonstrimpel.com which allows downloading stock price data into Excel.
Note that this is not an FTS site and we cannot guarantee that it will either work as desired or be available over time.
Alternatively, you can get the data into
an Excel Spreadsheet from other data sources that you have access to.
Tip: Historical data sources may have
missing and or incorrect observations. The advantage of first bringing
data into an Excel Spreadsheet is that this provides a very flexible tool for
first cleaning up your data (if required) before jumping into the analysis.
After you launch the Web Data Module you will
see these same instructions in the right frame. These instructions will
step you through the use of the data module. These steps will let you
automatically download historical price data in the form required by this
Portfolio Analysis module.
Alternatively, you can create your own
spreadsheet in the appropriate form from whatever historical database you have
access to. The appropriate format is as follows:
Step 1: Price or Return Data Format
The historical data needs to be in an Excel
spreadsheet in a block of cells. For example, in row 1, column 1 you
input the data as follows (1,1 is used for example purposes only you can place
the block anywhere in the spreadsheet):
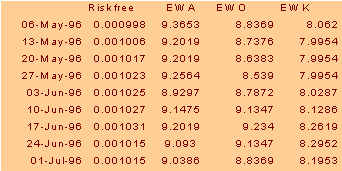
In the above you can see that the first row
contains security names. The security names are in row 1 columns 2,
3,4,5,..... In the current example these securities are the Webs listed on
Amex (EWA is Australia, EWO is Austria etc.,). The name is column
2 is Riskfree. This column contains interest rate data which is
optional.
Column 1 is optional but is useful for control
reasons because it contains the data. You can see that the current
example is using weekly price data and the Riskfree rate is scaled to be
weekly in decimal form.
Note: Always keep your time scale
constant across securities (e.g., daily, weekly, or monthly). This makes
it easier to interpret output because returns will be scaled relative to 1
time unit where your data defines this unit of time.
Note: Data must be sorted oldest
to latest. If your data source uses the opposite convention then use the
spreadsheet sort function (carrying along all columns) to sort column 1 into
ascending order.
Column 2 contains interest rate
information. This column does not need to be present. In addition,
if present it can be in any column.
Columns 3, 4, .... contain the price
data. You can use either price or return data the choice is yours.
Step 2: Linking to the Portfolio
Analysis Module
Open your Excel Spreadsheet and then click on
the button to the left titled: Find Excel Worksheets
This will locate all worksheets that you
currently have opened. So be careful to use the drop down menu
immediately below the Find Excel Worksheets button to select the appropriate
sheet.
If you do not specify the correct data sheet no
data will befound.
Step 3: Telling the Portfolio Analysis
Module about your Spreadsheet Layout
You must now specify the following information
using the textboxes to the left and drop down if necessary.
First, using the drop down change the default
Price Data to Return Data only if you are working with returns.
Second, specify the row number that you have
security names in. In our example above this was row 1.
Third, specify the data block
information. That is, the first and last row and first and last columns
that contain the historical data.
Fourth, if you have index and or interest rate
data then check the appropriate check boxes otherwise leave blank.
Finally, click on Initialize to bring the data
in.
If you have correctly linked you will see the
security names listed. Otherwise select the appropriate worksheet name
from the Worksheets Found drop down menu and re-click on Initialize.
Step 4: Selecting what Securities to
Work With
Your spreeadsheet may contain additional
securities that you are not interested in analyzing at the present time.
The module now lets you specify what subset to work with.
First, if you want to select all just double
click above the first security name. You will see Yes appear above each
security name.
Second, if you want a subset it is usually
quicker to select all and then turn of the Yes by clicking above the security
names that you do not want. You will see that this toggles between blank
and Yes.
Alternatively, you can select individual
securities by just clicking above them to toggle on the Yes.
Final Note: If you are using interest
rate data and or you want to specify an index for computing betas relative to
in a Single Index Model analysis then you must indicate what these two
securities are.
To do this click on the appropriate security
name and then press R for risk free rate or I for Index.
Now you are ready to
use the module for building and analyzing different portfolio
strategies. Click on the Back button or Restart
to return to the page that provides this instruction (see steps 2 and 3 when
you return to this page).
OS Financial Trading System, PO Box 11356, Pittsburgh, PA 15238 USA, Phone 1-800-967-9897, Fax 1-412-967-5958, Email
fts@ftsweb.com,
(C) Copyright 2000, OS Financial Trading System