How does the minimum variance frontier change over time?
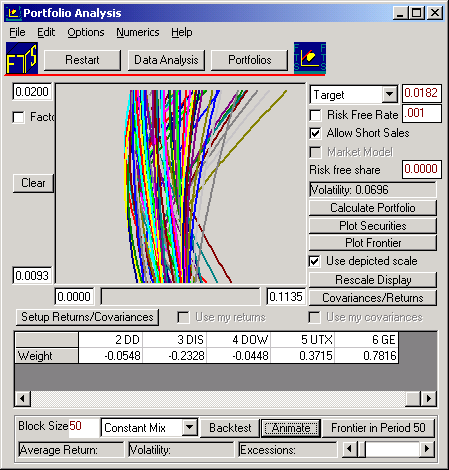
Refer to the top screen dump. If you click on the Animate button with Block size left at 50 (months), you will see how the minimum variance frontiers move around over time. This sequences is computed as follows:
The first 50-month's returns are used to construct the initial minimum variance frontier from, then the oldest month is dropped and the 51st month is added. The minimum variance frontier is re-estimated and re-plotted. This then continues by dropping the current oldest month and adding the 52nd month, re-estimating and plotting and so on until all data is used up.
This gives you insight into the dynamics of risk and return. It also underscores one of the significant problems that arise when attempting to apply the Markowitz diversification technique. The weights selected may have been efficient using all realized data assuming that the minimum variance frontier is stationary. In the real world this is not the case and so the portfolios identified are likely to fail to be ex ante (i.e., in an expected sense) efficient! Backtesting can help you assess the magnitude of this problem, a tool that we consider next.