Plotting the set of investment possibilities?
If the distribution of returns is the symmetrical Normal distribution then all information about this distribution is captured by the first two moments, mean and variance. The first moment equals the return we expect from the investment and square root of the second moment, volatility, is the risk. When viewed this way we can plot any investment opportunity in a two dimensional space with risk on the Y-axis and return on the X-axis.
Markowitz's contribution to investment theory was to first represent risky assets in this way and then apply optimization techniques to identify the best investment strategies for investors who prefer more return to less, and less risk to more. Formally, this was the set of investments that could not be dominated by any other investment. Dominance is defined as satisfying the following:
Investment A dominates B if A has higher expected return and at least the same or lower level of risk (volatility), or equivalently A has lower risk (volatility) with at least the same or higher expected return.
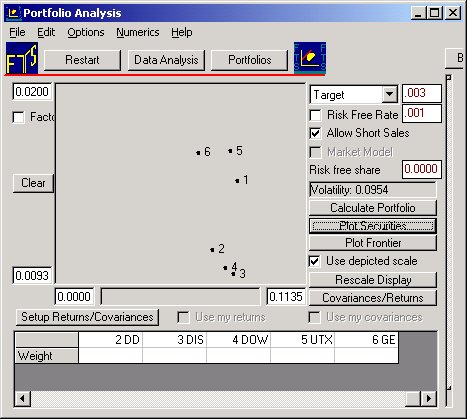
Markowitz solved the mathematical programming problem that let an investor identify the set of risk asset portfolios that cannot be dominated. The portfolio module lets you apply Markowitz's technique to real world data with and without short selling permitted. In this exercise we will permit short sales (i.e., portfolio weights are allowed to become negative). Click on the button Plot Securities. Click on the button Plot Securities. This plots in risk (X-axis) and return (Y-axis) the realized risk and return for each of the securities. You may want to modify the automatic scaling by typing in the desired scale numbers directly (which the above screen has done). For the six stocks provided over the time period January 1990 to November 2001 you can see that in the upper part of the graph are GE (6) and UTX (5). Neither dominates each other because although UTX has slightly higher return GE has less volatility. This is not the case for Disney (3) which is dominated by for example Dow (4) which is in turn dominated by GE (6).
The above simple analysis of dominance is accurate if it were the case that each of these potential investments were mutually exclusive. That is, investing in one precludes being able to invest in another. However, for the case of stocks this is not the case. Investors can form portfolios and therefore we must take into account not only the mean and variance of returns but also how returns co-vary among themselves.
This was one of the major insights from Markowitz. So by forming portfolios we can dominate the strategy of selecting any single stock. We will explore this point next.