Getting the lesson data spreadsheet: ca0.xls
To use the FTS Portfolio Return Module first get historical price or return data into Excel. By using the FTS Historical Data Collection Module you can automate this process and this is how ca0.xls was created. When using the Data Collection Module you must first specify each stock or fund's code in row 1 and continuing across columns for every security you want to collect data for. The Data Collection Module lets you specify what type, Daily, Weekly or Monthly and over what time period.
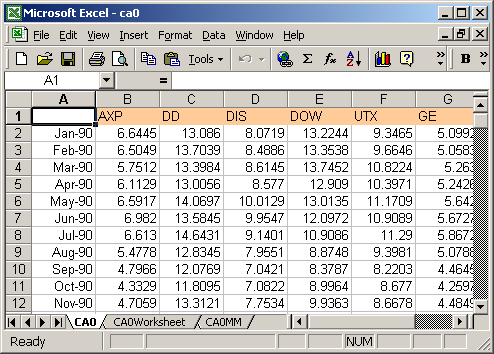
To keep this lesson simple we will use six securities. The FTS Modules let you work with as many as your PC memory will handle.
To start this lesson launch the Excel spreadsheet ca0.xls by double clicking on the hypertext.
User Note: You can use data in either price or return format. In this lesson our raw data is in price format. In addition, Excel is the data source so any data cleaning or prior re-working of data (i.e., fixing up missing data etc., should be done in Excel which it is well suited to). Once you attach to an Excel Spreadsheet the FTS Portfolio Return Module assumes that it has already been cleaned up if necessary.